Texas electricity data, research, and analysis for journalists, researchers, and policymakers. Every figure links to its source, method and downloadable data.
Usage-sensitive plans: the advertised price depends on how much you use
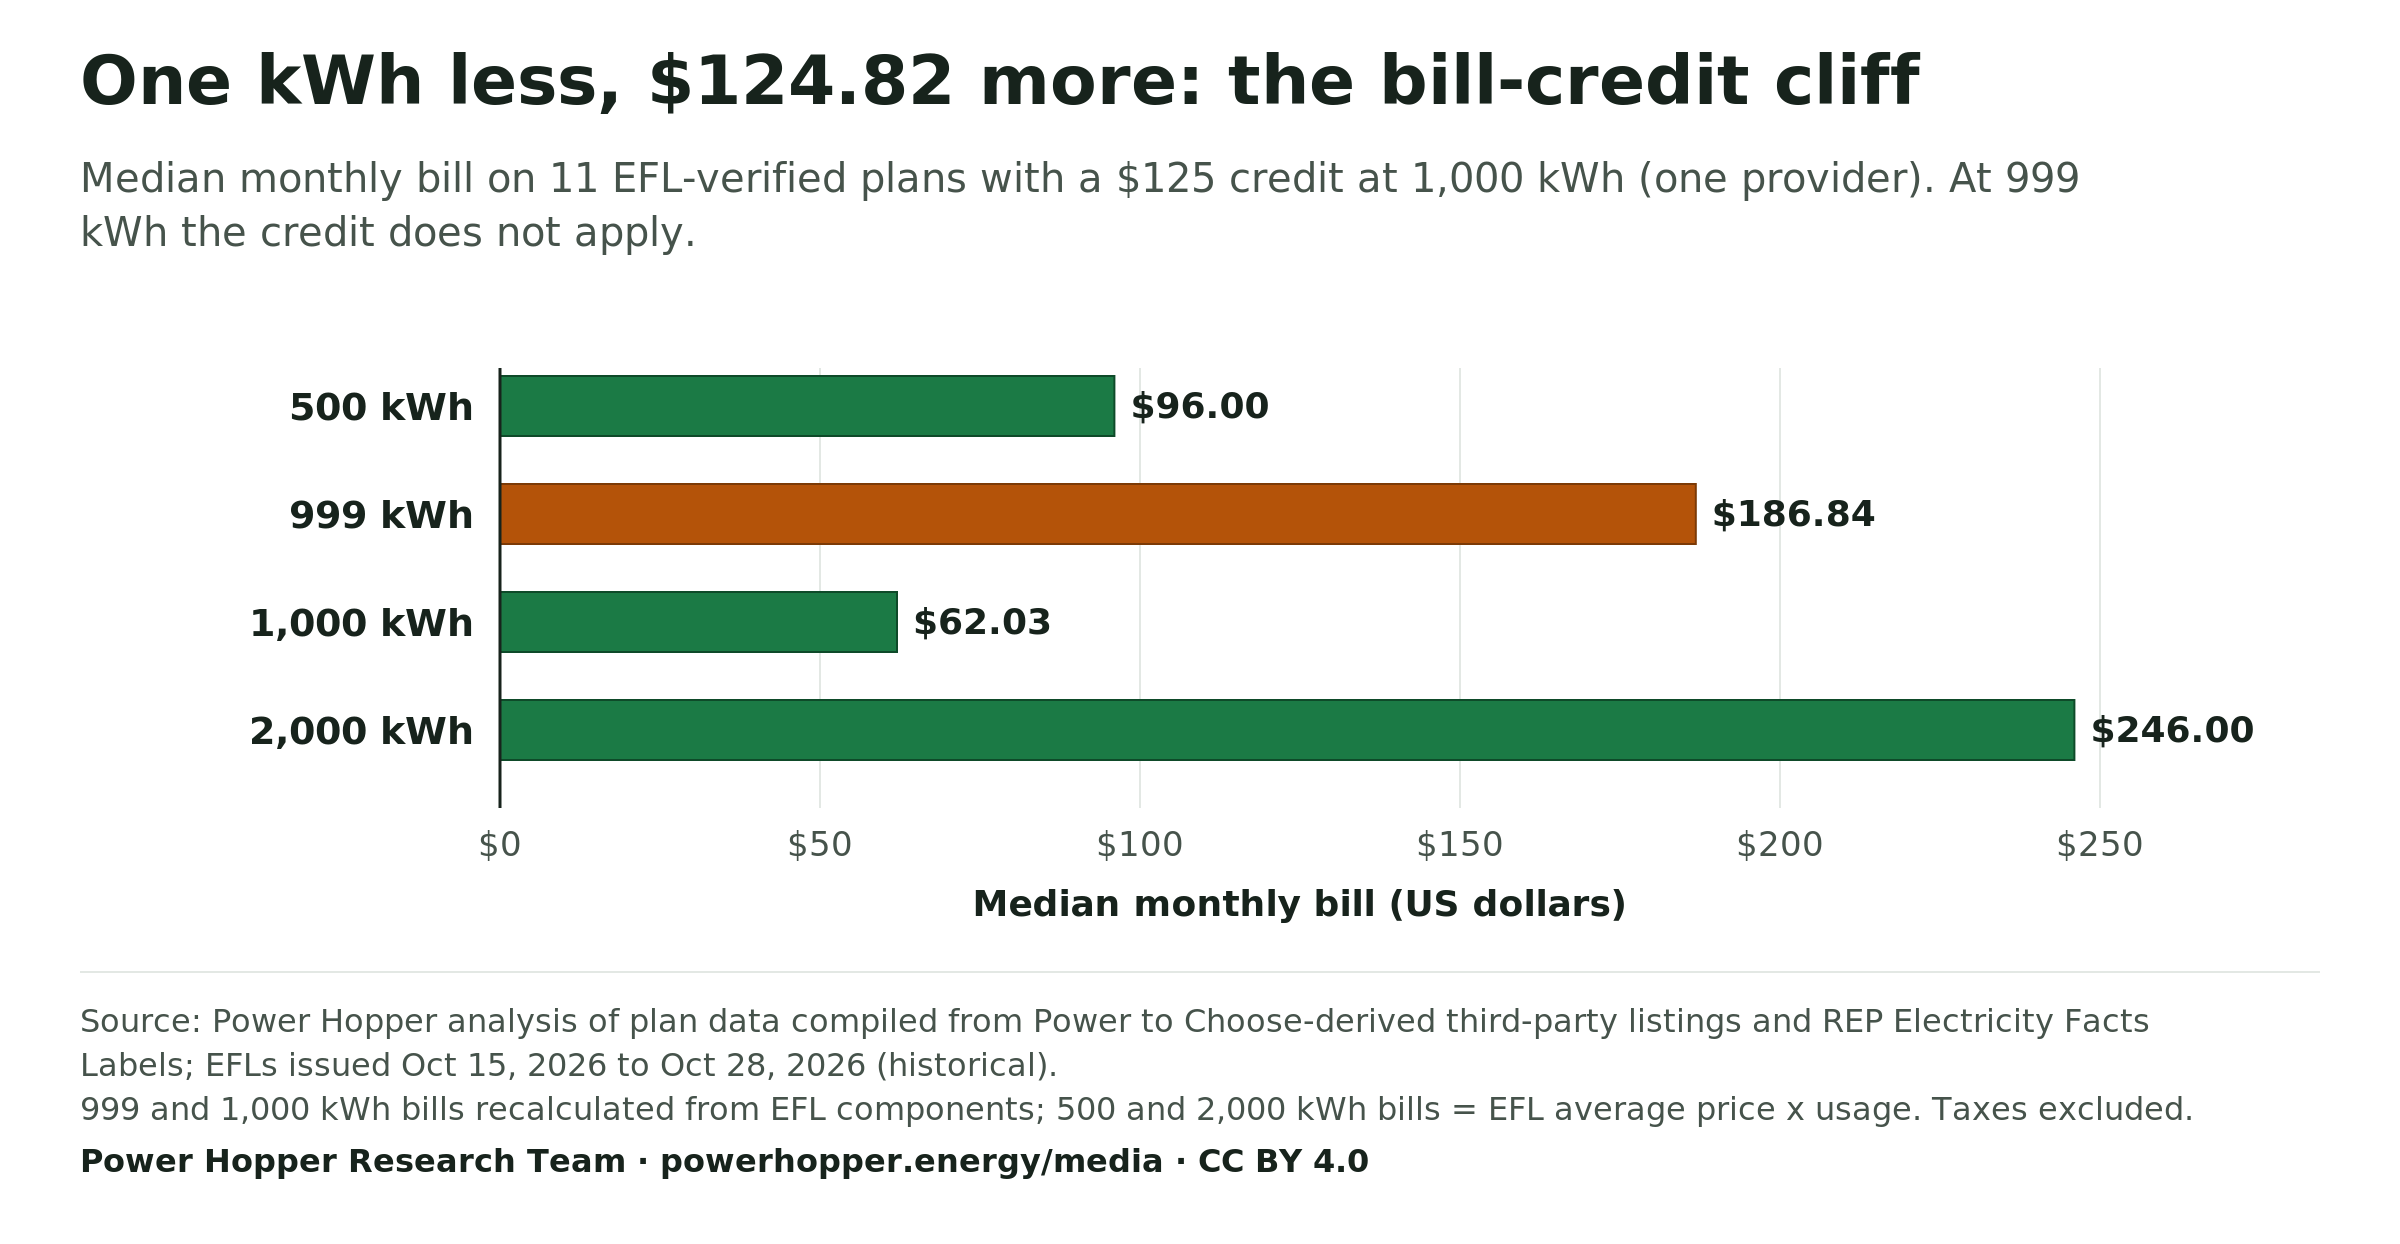
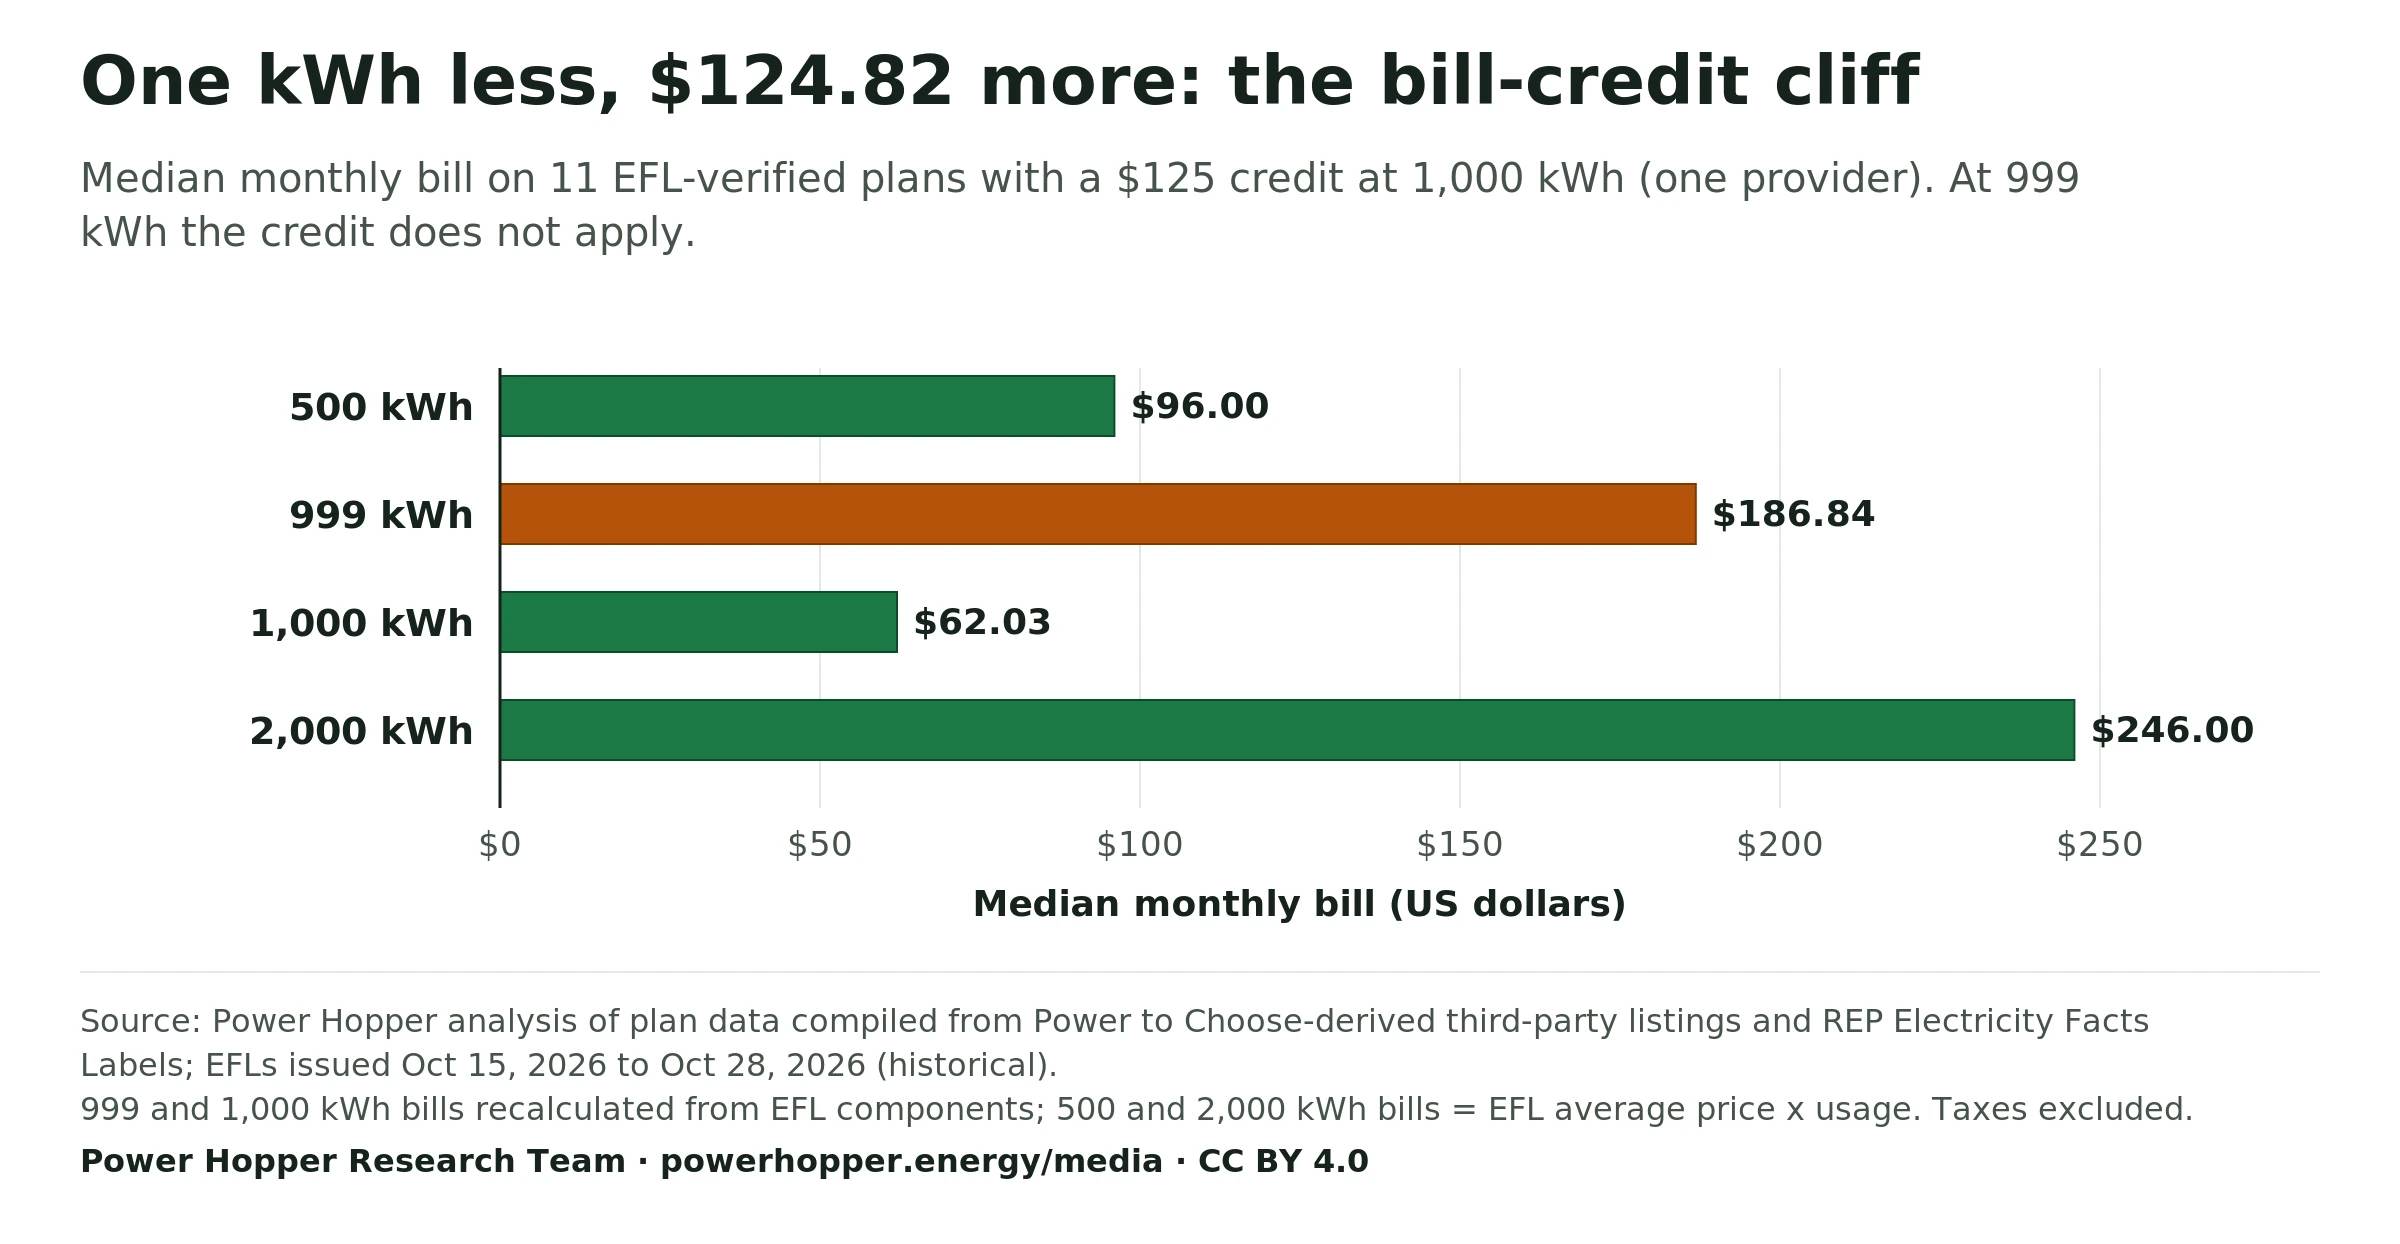
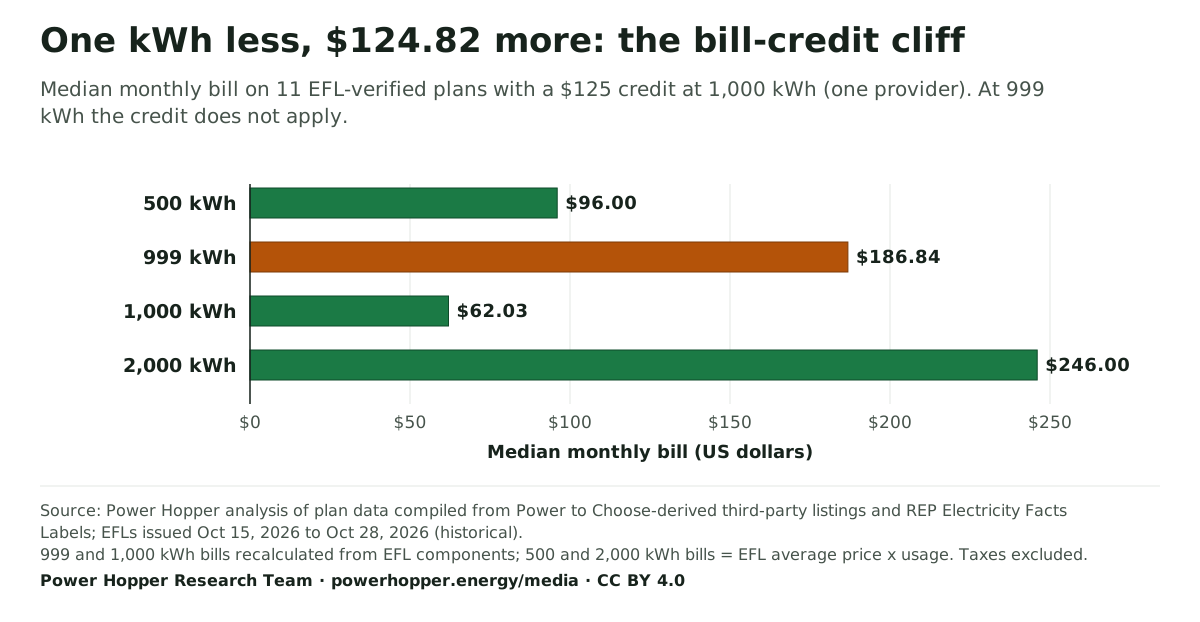
Some plans subtract a bill credit only when monthly usage reaches 1,000 kWh. On 11 EFL-verified $125 bill-credit plans, the median bill was $62.03 at 1,000 kWh and $186.84 at 999 kWh: one kilowatt-hour less cost $124.79 to $124.82 more. These plans come from one provider and the EFLs are historical.
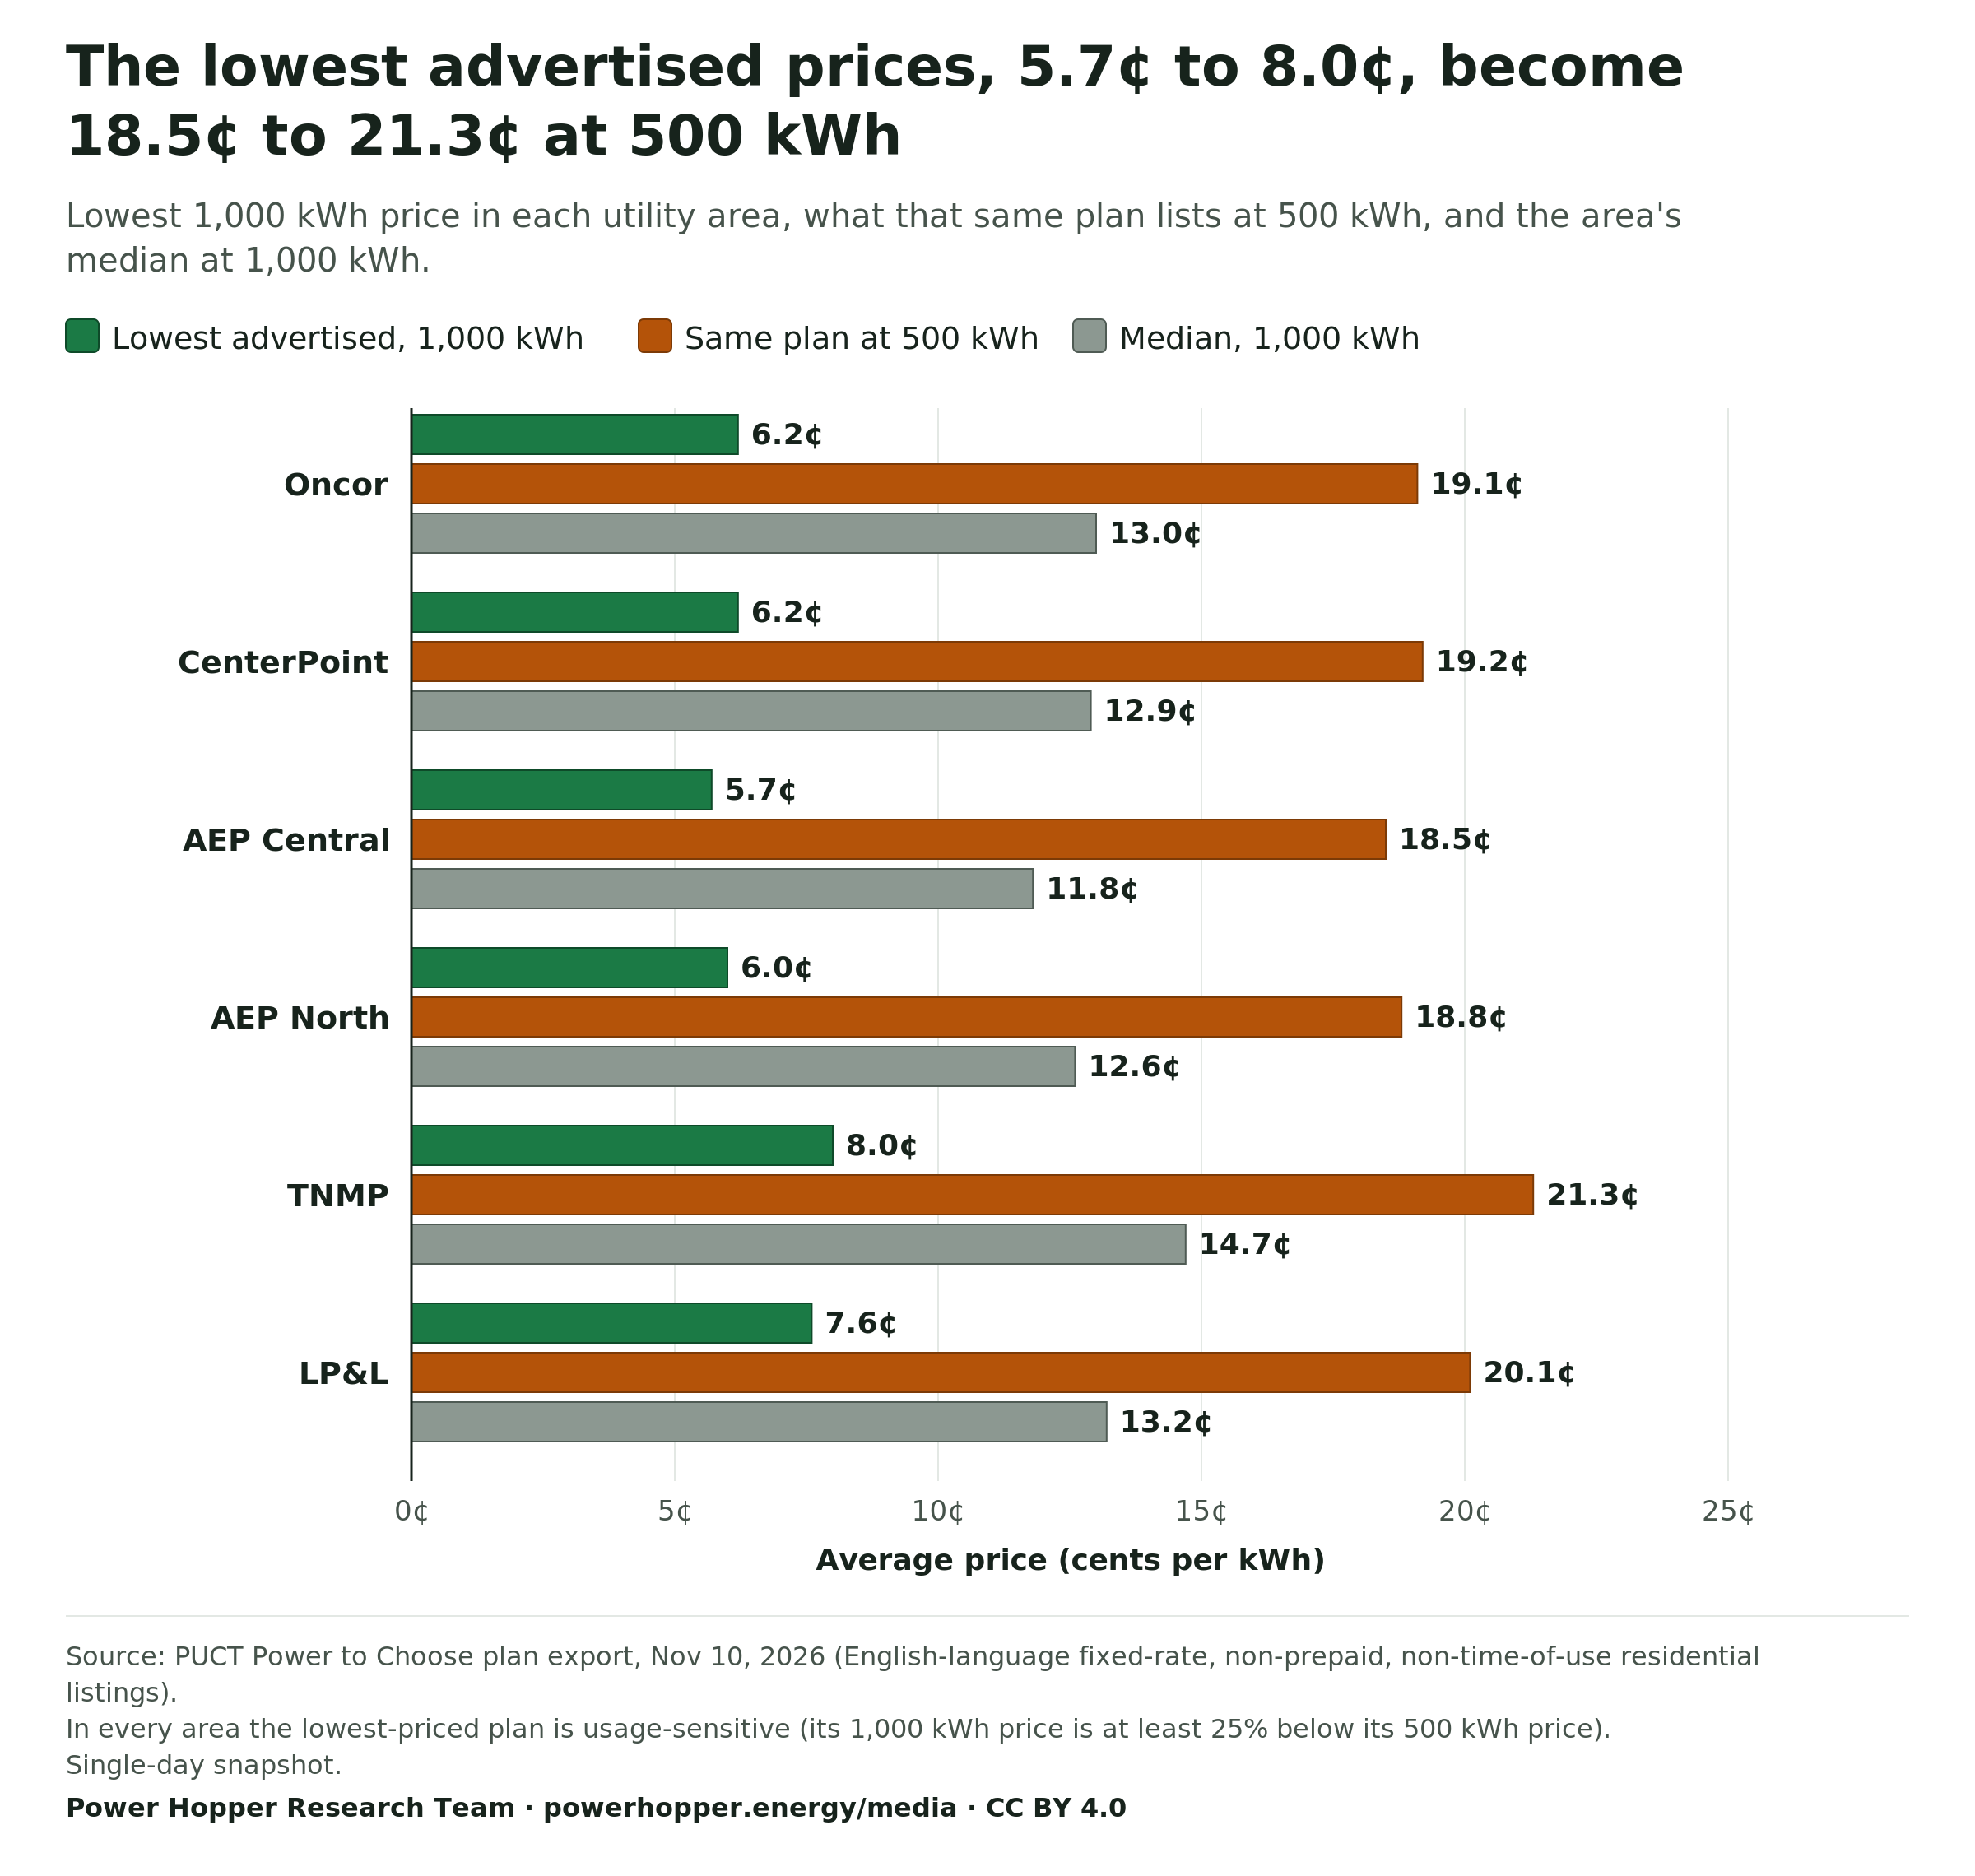
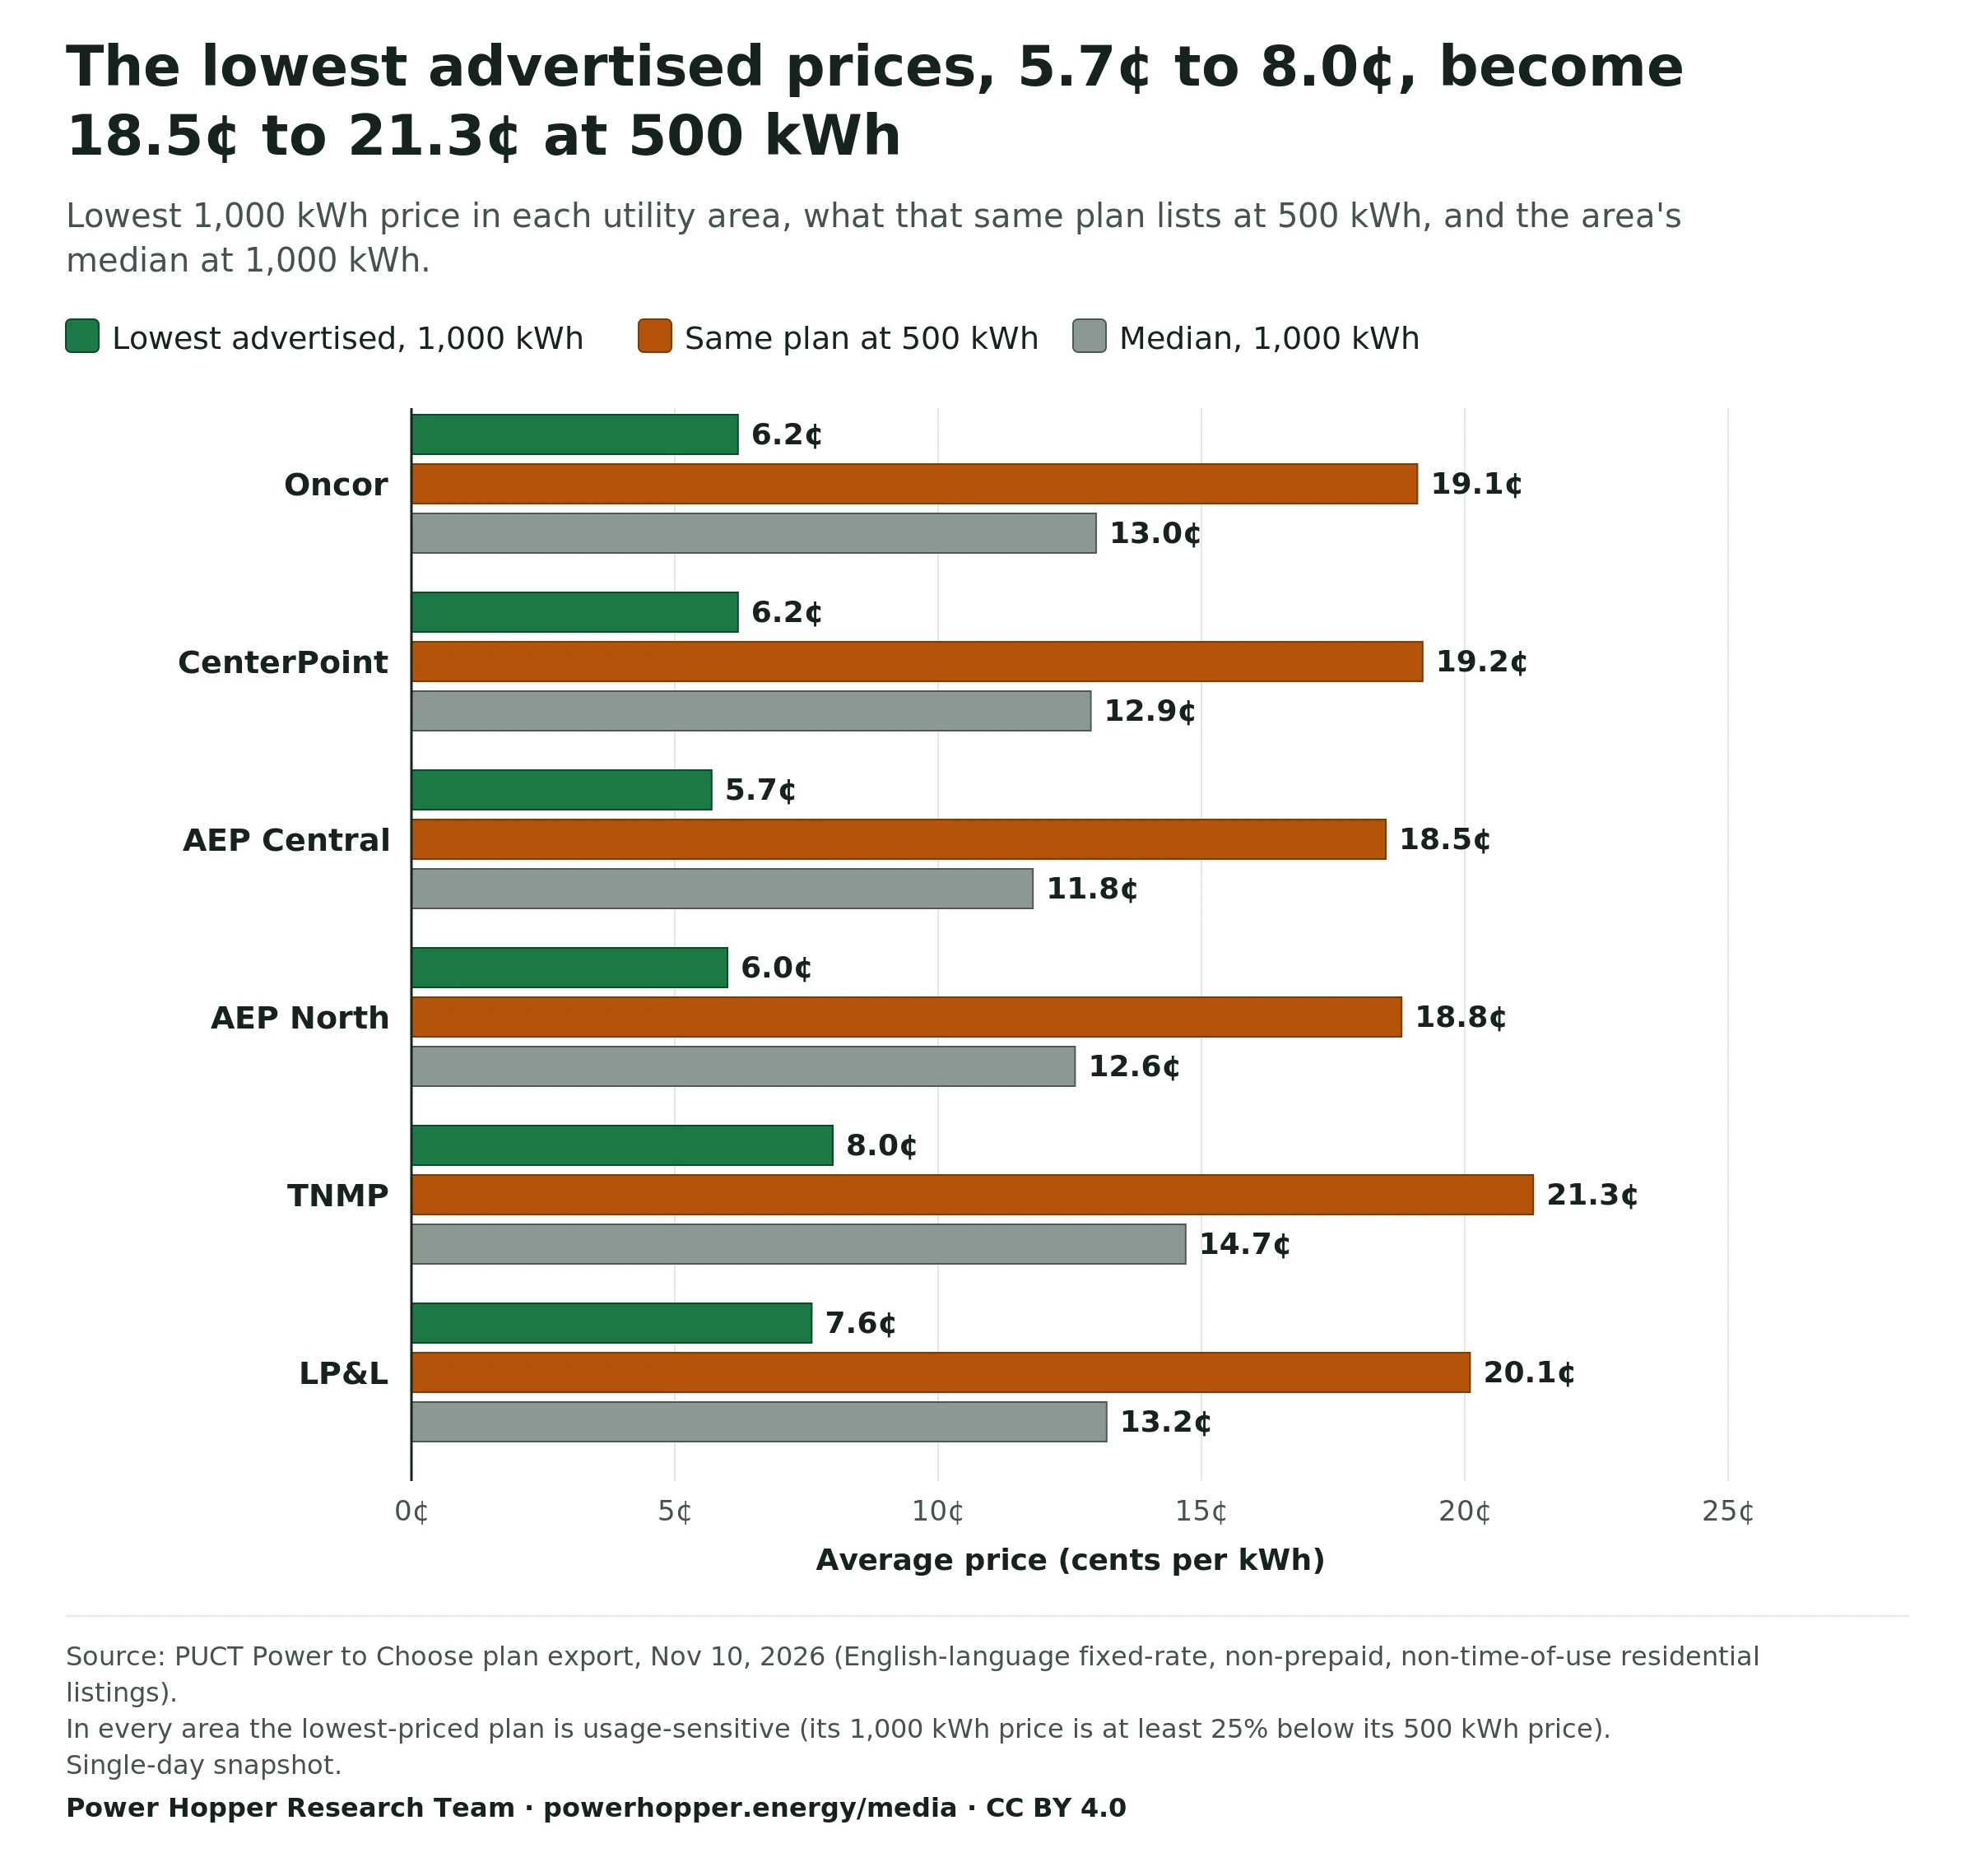
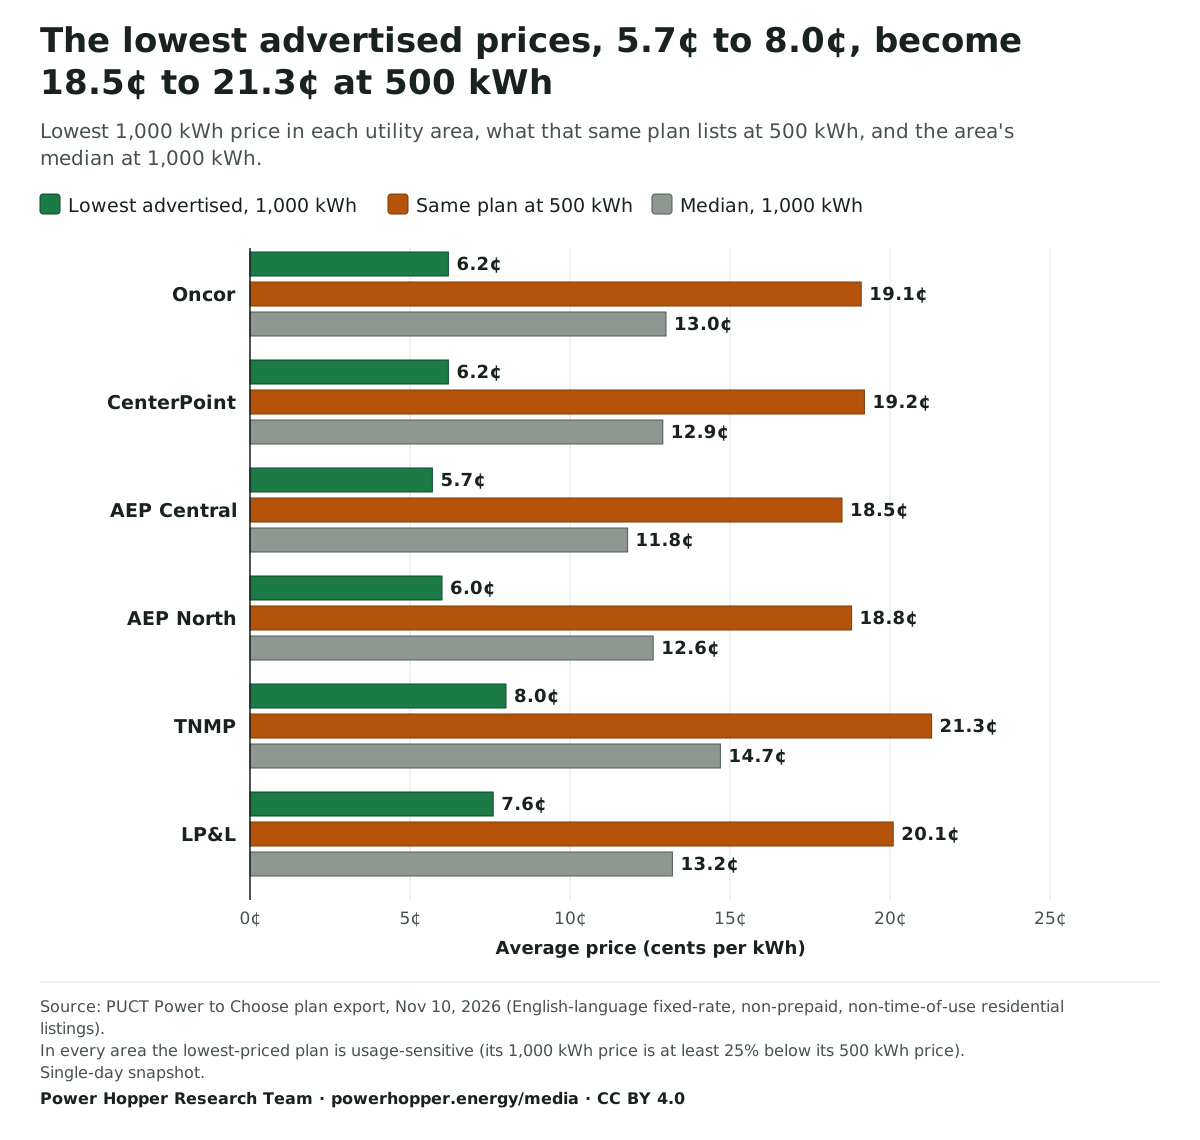
The same design sets the lowest advertised prices. On Nov 10, 2026, the lowest 1,000 kWh price in every utility area belonged to a usage-sensitive plan, and those plans listed 18.5¢ to 21.3¢ at 500 kWh. Usage-sensitive plans were 6% to 8% of fixed-rate listings.
Plan Structure · EFLs issued Oct 15, 2026 to Oct 28, 2026
One kWh less, $124.82 more: the bill-credit cliff
Median monthly bill on 11 EFL-verified plans with a $125 credit at 1,000 kWh (one provider). At 999 kWh the credit does not apply.
500 kWh
$96.00
999 kWh
$186.84
1,000 kWh
$62.03
2,000 kWh
$246.00
$0$50$100$150$200$250
Median monthly bill (US dollars)
Source: Power Hopper analysis of plan data compiled from Power to Choose-derived third-party listings and REP Electricity Facts Labels; EFLs issued Oct 15, 2026 to Oct 28, 2026 (historical). 999 and 1,000 kWh bills recalculated from EFL components; 500 and 2,000 kWh bills = EFL average price x usage. Taxes excluded.
Power Hopper Research Team. "The bill-credit cliff: median monthly bill at 500, 999, 1,000 and 2,000 kWh." Chart. The 1,000 kWh Bill-Credit Threshold: What One Kilowatt-Hour Costs dataset. Power Hopper Media Data Room, published November 10, 2026. https://powerhopper.energy/media/charts#chart-texas-bill-credit-cliff-median-bill-500-999-1000-2000-kwh. Accessed [date accessed].
Data table
The bill-credit cliff: median monthly bill at 500, 999, 1,000 and 2,000 kWh (Median monthly bill (US dollars))
Monthly usage
Median monthly bill
500 kWh
$96.00
999 kWh
$186.84
1,000 kWh
$62.03
2,000 kWh
$246.00
Electricity Rates · Nov 10, 2026 snapshot
The lowest advertised prices, 5.7¢ to 8.0¢, become 18.5¢ to 21.3¢ at 500 kWh
Lowest 1,000 kWh price in each utility area, what that same plan lists at 500 kWh, and the area's median at 1,000 kWh.
Lowest advertised, 1,000 kWh
Same plan at 500 kWh
Median, 1,000 kWh
Oncor
Lowest advertised, 1,000 kWh: 6.2¢
Same plan at 500 kWh: 19.1¢
Median, 1,000 kWh: 13.0¢
CenterPoint
Lowest advertised, 1,000 kWh: 6.2¢
Same plan at 500 kWh: 19.2¢
Median, 1,000 kWh: 12.9¢
AEP Central
Lowest advertised, 1,000 kWh: 5.7¢
Same plan at 500 kWh: 18.5¢
Median, 1,000 kWh: 11.8¢
AEP North
Lowest advertised, 1,000 kWh: 6.0¢
Same plan at 500 kWh: 18.8¢
Median, 1,000 kWh: 12.6¢
TNMP
Lowest advertised, 1,000 kWh: 8.0¢
Same plan at 500 kWh: 21.3¢
Median, 1,000 kWh: 14.7¢
LP&L
Lowest advertised, 1,000 kWh: 7.6¢
Same plan at 500 kWh: 20.1¢
Median, 1,000 kWh: 13.2¢
0¢5¢10¢15¢20¢25¢
Average price (cents per kWh)
Source: PUCT Power to Choose plan export, Nov 10, 2026 (English-language fixed-rate, non-prepaid, non-time-of-use residential listings). In every area the lowest-priced plan is usage-sensitive (its 1,000 kWh price is at least 25% below its 500 kWh price). Single-day snapshot.
Power Hopper Research Team. "Lowest advertised 1,000 kWh price, the same plan at 500 kWh, and the median, Nov 10, 2026." Chart. Usage-Sensitive Plans and the Lowest-vs-Median Price Spread by Utility dataset. Power Hopper Media Data Room, published November 10, 2026. https://powerhopper.energy/media/charts#chart-texas-lowest-vs-median-plan-price-1000-kwh-2026-11-10. Accessed [date accessed].
Data table
Lowest advertised 1,000 kWh price, the same plan at 500 kWh, and the median, Nov 10, 2026 (Average price (cents per kWh))
Delivery utility
Lowest advertised, 1,000 kWh
Same plan at 500 kWh
Median, 1,000 kWh
Oncor
6.2¢
19.1¢
13.0¢
CenterPoint
6.2¢
19.2¢
12.9¢
AEP Central
5.7¢
18.5¢
11.8¢
AEP North
6.0¢
18.8¢
12.6¢
TNMP
8.0¢
21.3¢
14.7¢
LP&L
7.6¢
20.1¢
13.2¢
Plan Structure · Nov 10, 2026 snapshot
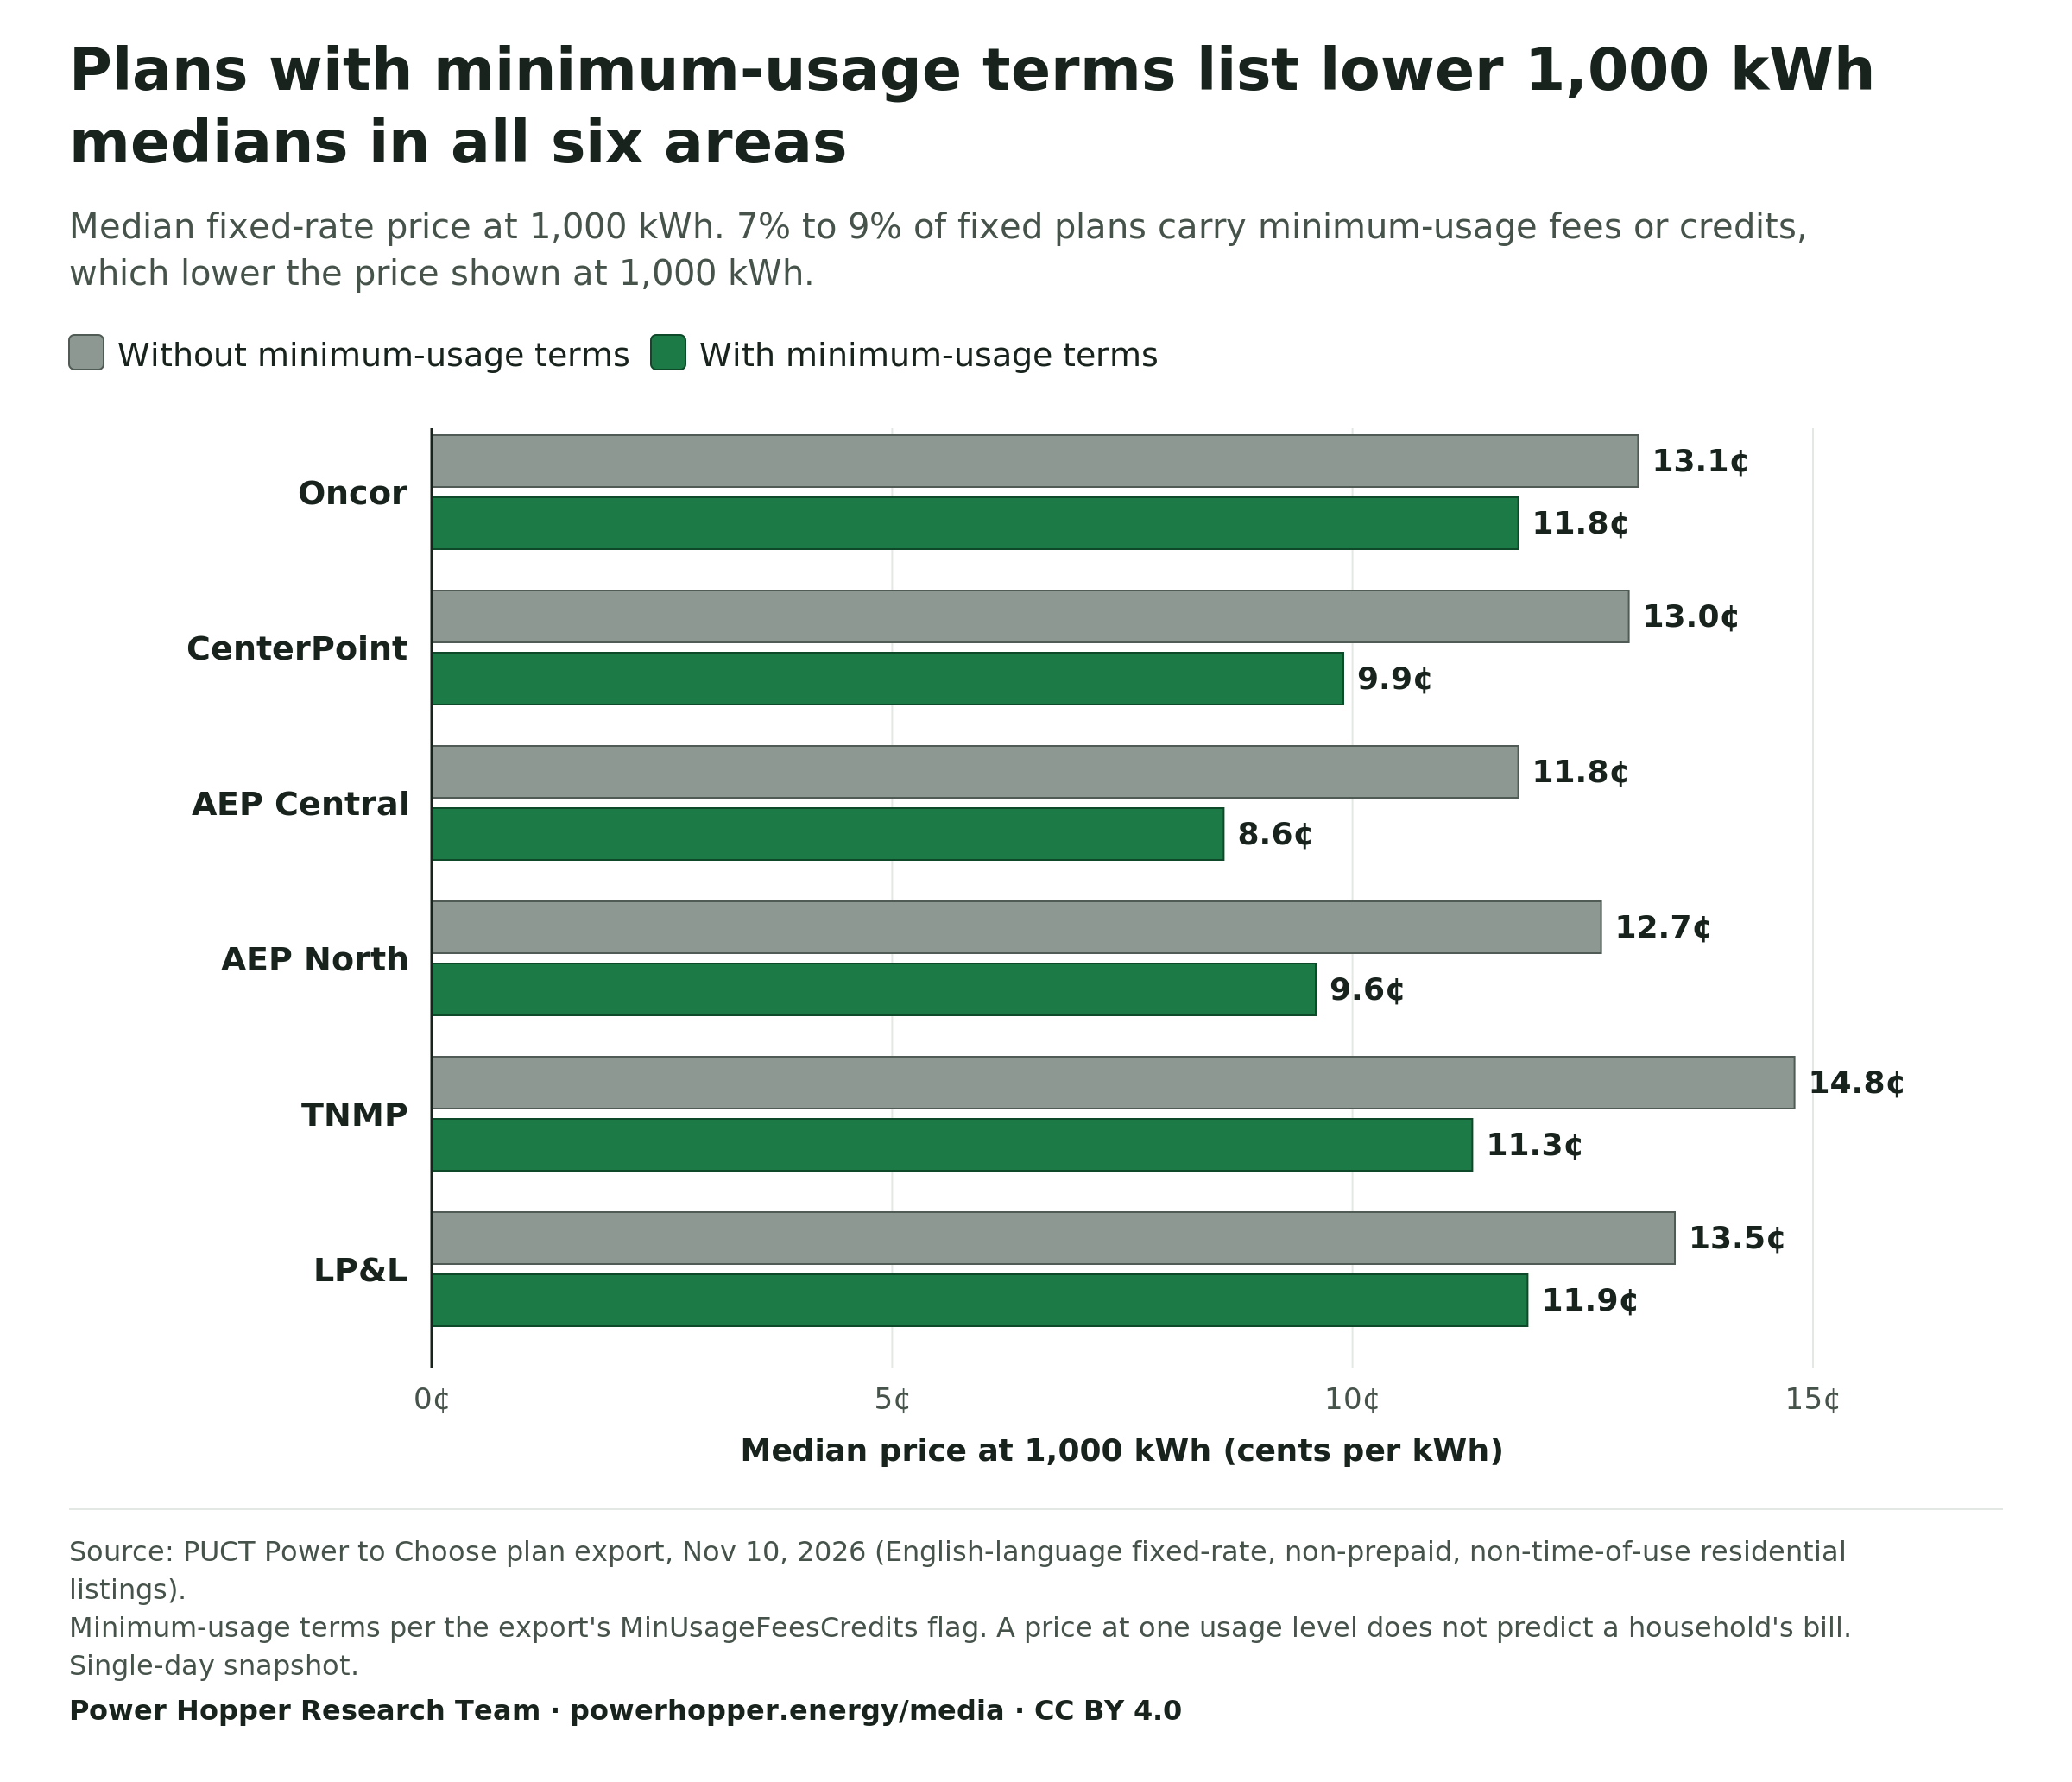
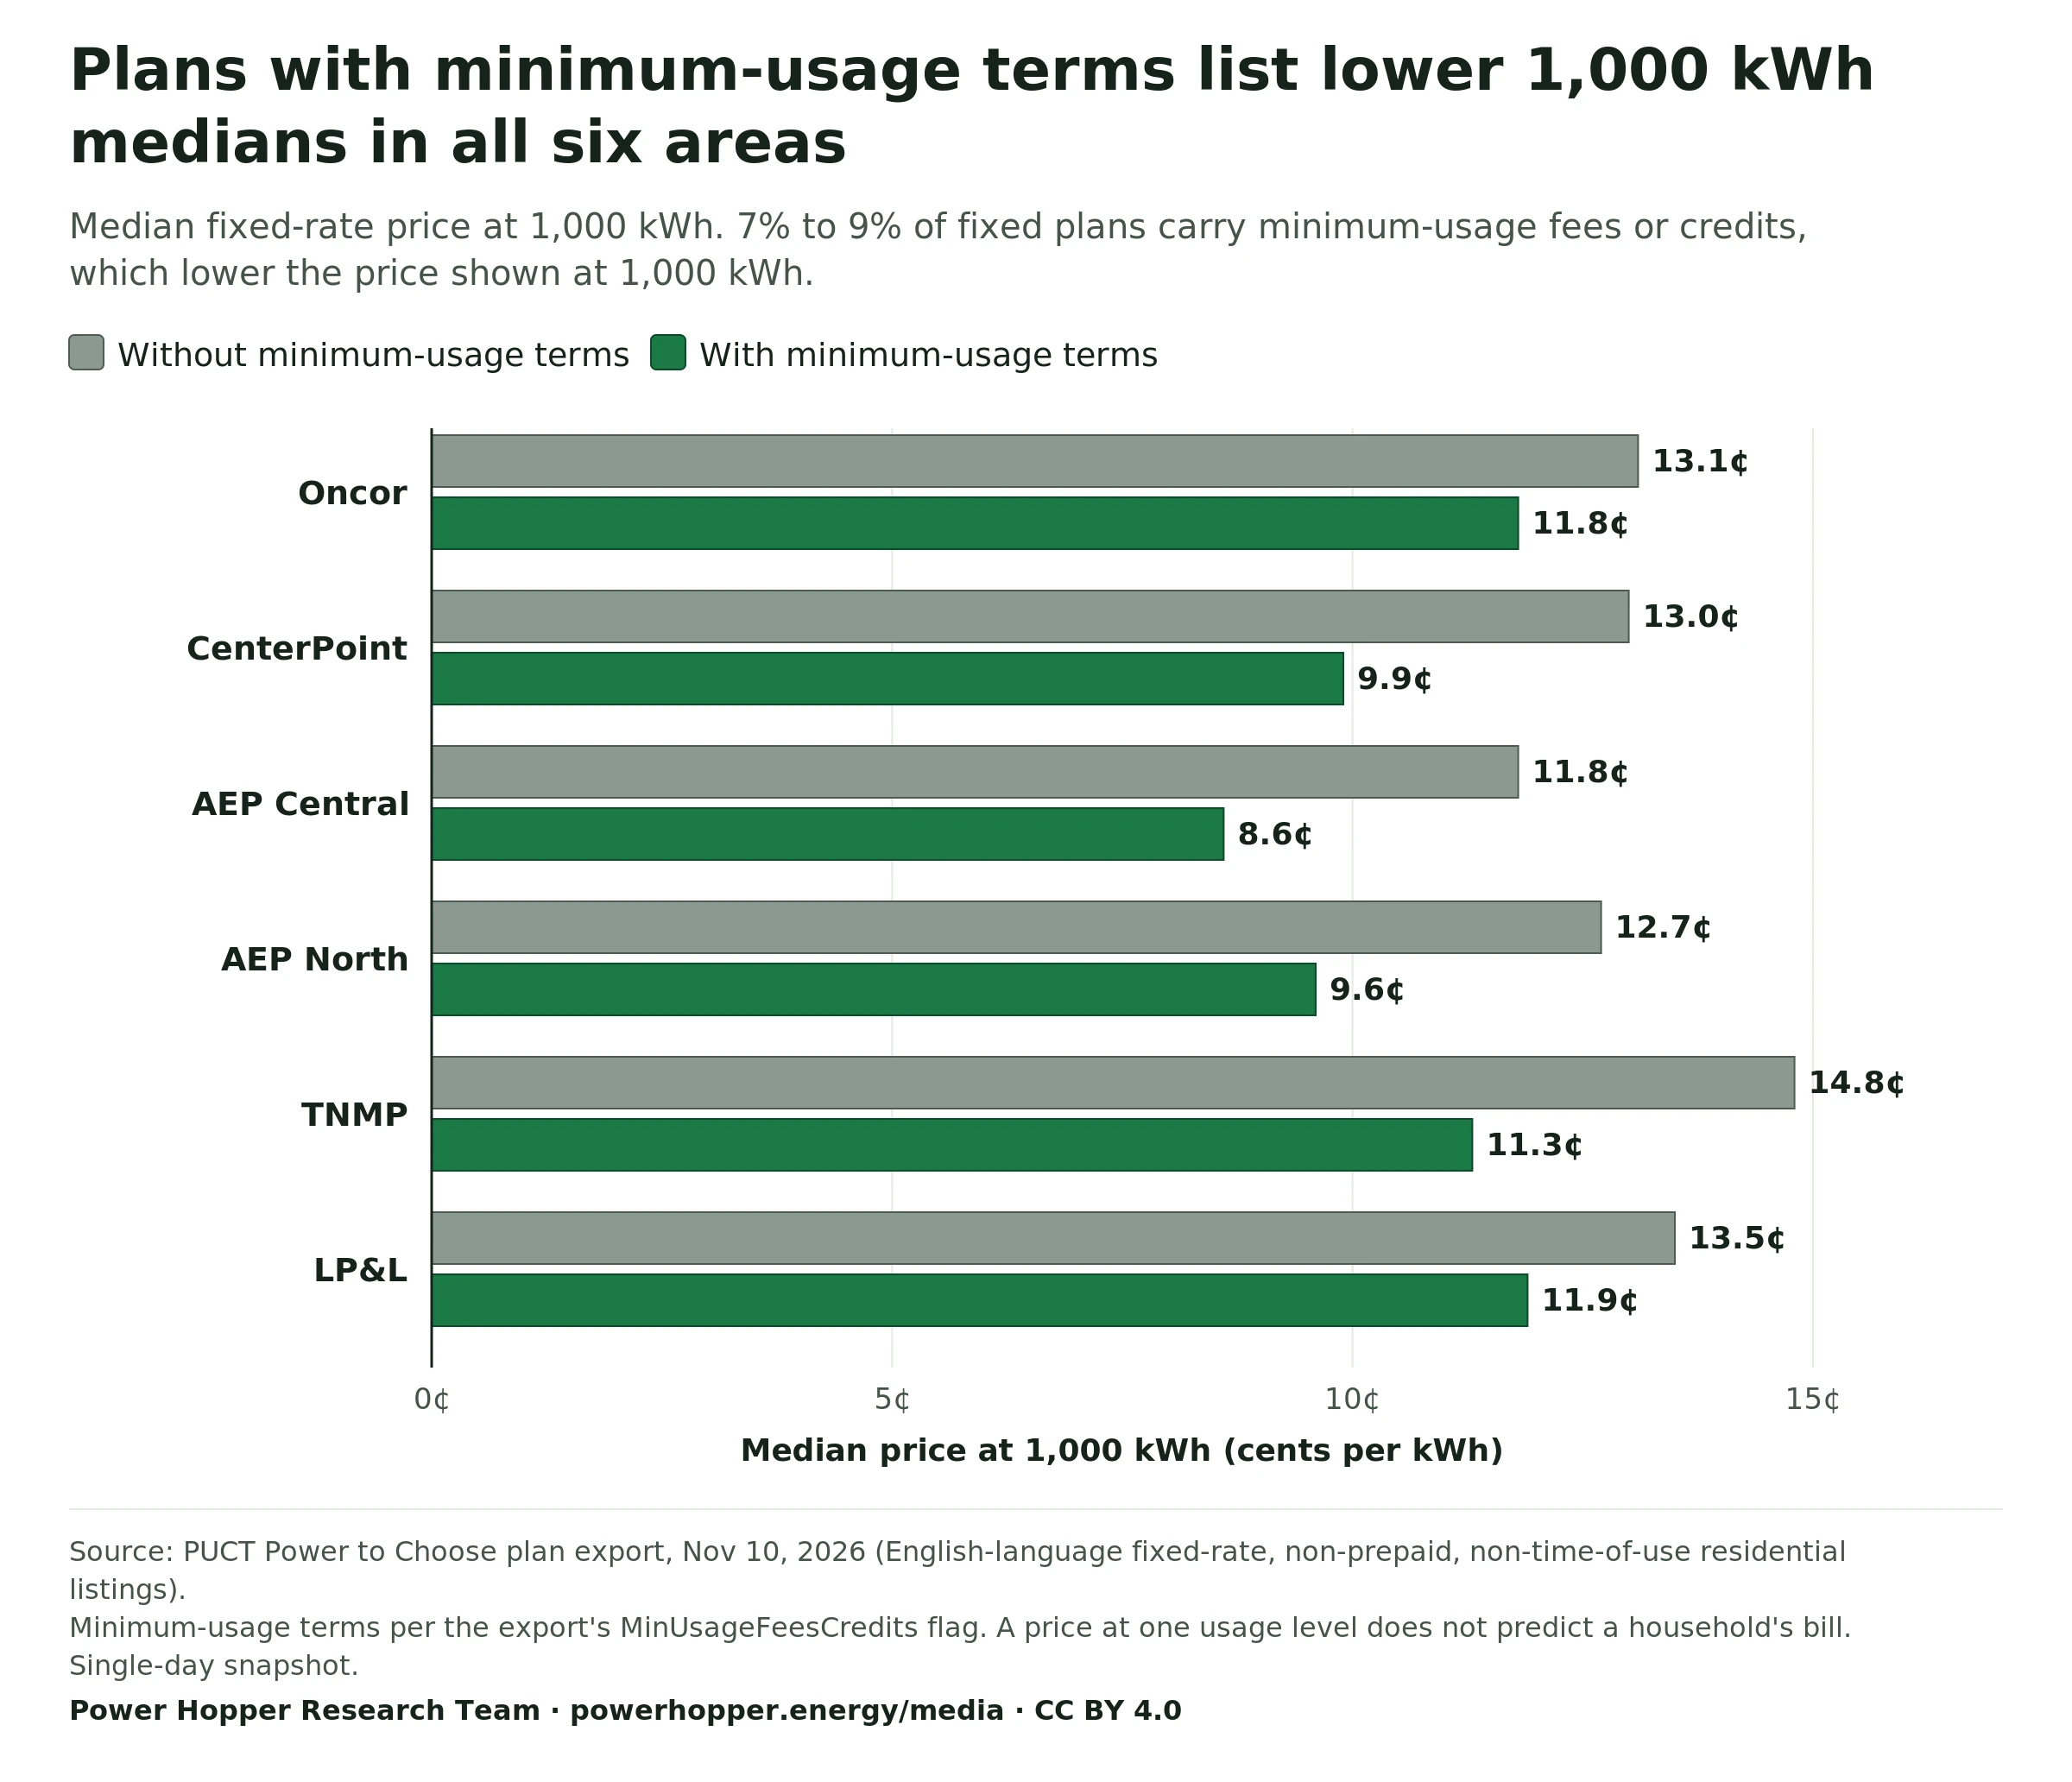
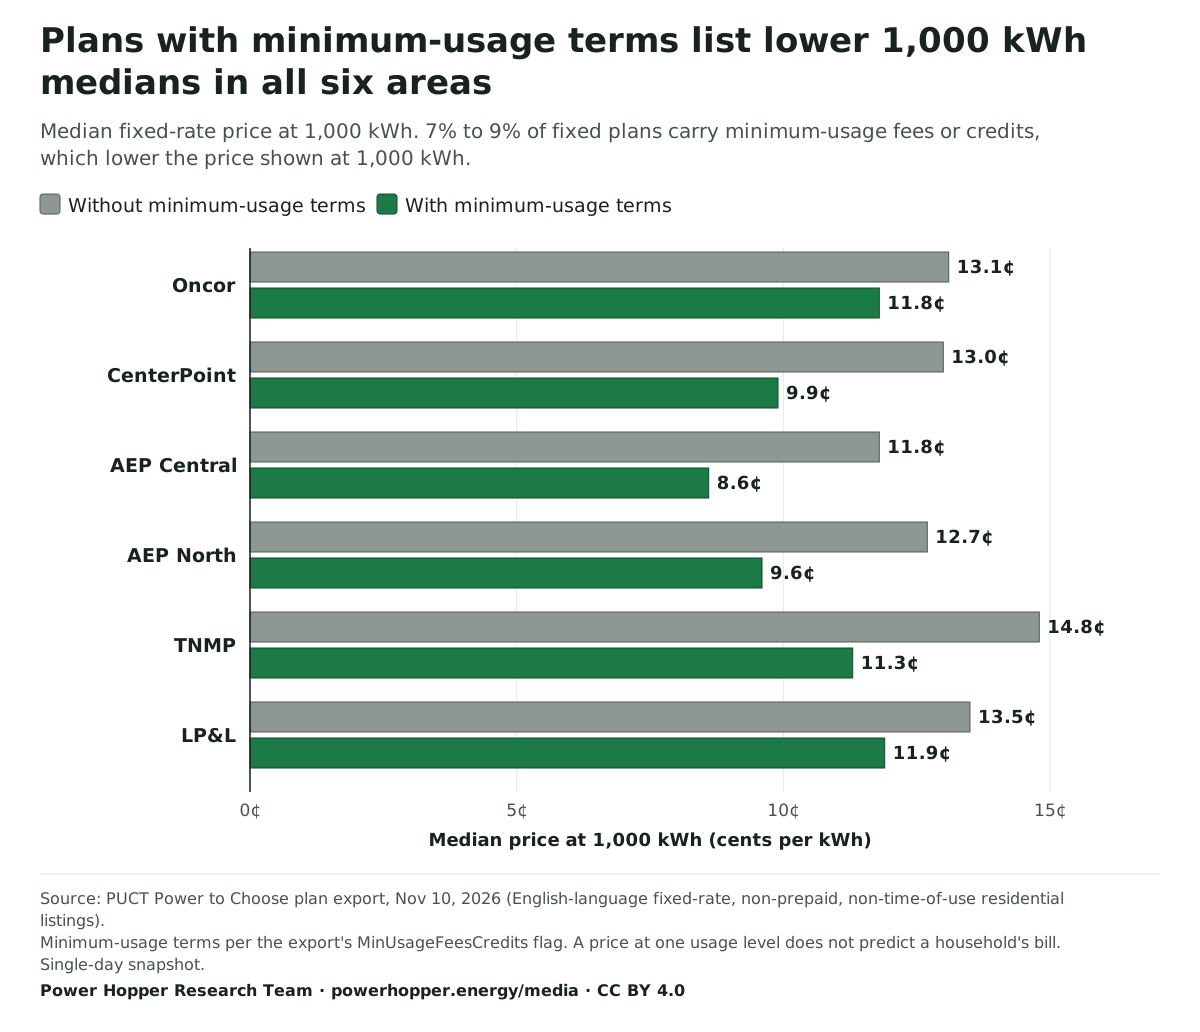
Plans with minimum-usage terms list lower 1,000 kWh medians in all six areas
Median fixed-rate price at 1,000 kWh. 7% to 9% of fixed plans carry minimum-usage fees or credits, which lower the price shown at 1,000 kWh.
Without minimum-usage terms
With minimum-usage terms
Oncor
Without minimum-usage terms: 13.1¢
With minimum-usage terms: 11.8¢
CenterPoint
Without minimum-usage terms: 13.0¢
With minimum-usage terms: 9.9¢
AEP Central
Without minimum-usage terms: 11.8¢
With minimum-usage terms: 8.6¢
AEP North
Without minimum-usage terms: 12.7¢
With minimum-usage terms: 9.6¢
TNMP
Without minimum-usage terms: 14.8¢
With minimum-usage terms: 11.3¢
LP&L
Without minimum-usage terms: 13.5¢
With minimum-usage terms: 11.9¢
0¢5¢10¢15¢
Median price at 1,000 kWh (cents per kWh)
Source: PUCT Power to Choose plan export, Nov 10, 2026 (English-language fixed-rate, non-prepaid, non-time-of-use residential listings). Minimum-usage terms per the export's MinUsageFeesCredits flag. A price at one usage level does not predict a household's bill. Single-day snapshot.
Power Hopper Research Team. "Fixed-plan medians at 1,000 kWh with and without minimum-usage terms, Nov 10, 2026." Chart. Texas Electricity Plan Structure by Utility dataset. Power Hopper Media Data Room, published November 10, 2026. https://powerhopper.energy/media/charts#chart-texas-fixed-plan-medians-with-and-without-minimum-usage-terms-2026-11-10. Accessed [date accessed].
Data table
Fixed-plan medians at 1,000 kWh with and without minimum-usage terms, Nov 10, 2026 (Median price at 1,000 kWh (cents per kWh))
ERCOT daily market pages are retained for Nov 2 to Nov 10, 2026 only, so month-ago and year-ago values are not available.
The PUCT publishes delivery rate reports monthly and Lubbock Power & Light adopts an annual tariff; there are no daily or weekly values.
Year-ago PUCT monthly reports were not retained, so no year-ago value is shown.
LP&L adopts one tariff per year, so there is no separate month-ago value. The year-ago value is the 2025-26 tariff, effective Nov 1, 2025.
Power to Choose snapshots are retained for Nov 10 and Oct 19, 2026 only (Oct 19 medians: Oncor 13.4¢, CenterPoint 13.2¢). Those are 22 days apart, not a monthly series, and two snapshots are not a trend.
† Oncor temporary rates for bills rendered on or after Oct 4, 2026 (PUCT Docket 59249). * LP&L is city-regulated, not under PUCT delivery tariffs.
By utility
The six delivery utility areas side by side
Showing: Delivery at 1,000 kWh
LP&L$62.58/mo
AEP North$59.00/mo
Oncor$72.73/mo
TNMP$85.27/mo
CenterPoint$70.23/mo
AEP Central$60.15/mo
LowerHigher
Schematic layout, not a map: tiles sit roughly where each utility serves, but service areas are irregular, and TNMP and AEP serve several separate regions. Shading compares the six values for the chosen measure.
Delivery charges (Nov 2026) and plan listings (Nov 10, 2026) by delivery utility
Utility
Regulator
Delivery at 1,000 kWh
Change
Median plan, 1,000 kWh
Lowest advertised, 1,000 kWh
Usage-sensitive
Minimum-usage terms
Fixed plans
Oncor †
PUCT
$72.73
$64.36 (+$8.37)vs Sep 1 report
13.0¢
6.2¢ 19.1¢ at 500 kWh
6%
7%
147
CenterPoint
PUCT
$70.23
$69.03 (+$1.20)vs Sep 1 report
12.9¢
6.2¢ 19.2¢ at 500 kWh
7%
8%
146
AEP Texas Central
PUCT
$60.15
$61.07 (−$0.92)vs Sep 1 report
11.8¢
5.7¢ 18.5¢ at 500 kWh
7%
7%
141
AEP Texas North
PUCT
$59.00
$59.93 (−$0.93)vs Sep 1 report
12.6¢
6.0¢ 18.8¢ at 500 kWh
6%
7%
141
TNMP
PUCT
$85.27
$81.87 (+$3.40)vs Sep 1 report
14.7¢
8.0¢ 21.3¢ at 500 kWh
6%
7%
142
Lubbock Power & Light
Lubbock City Council
$62.58
$63.12 (−$0.54)vs 2025-26 tariff
13.2¢
7.6¢ 20.1¢ at 500 kWh
8%
9%
89
Sources: PUCT TDU rate reports (Nov 1 and Sep 1, 2026); LP&L tariffs; PUCT Power to Choose export (Nov 10, 2026). Delivery charges exclude energy charges. † Oncor temporary rates (Docket 59249). Usage-sensitive: 1,000 kWh price at least 25% below the 500 kWh price.
Utility Delivery Charges · Nov 1, 2026 delivery report; Nov 10, 2026 plan export
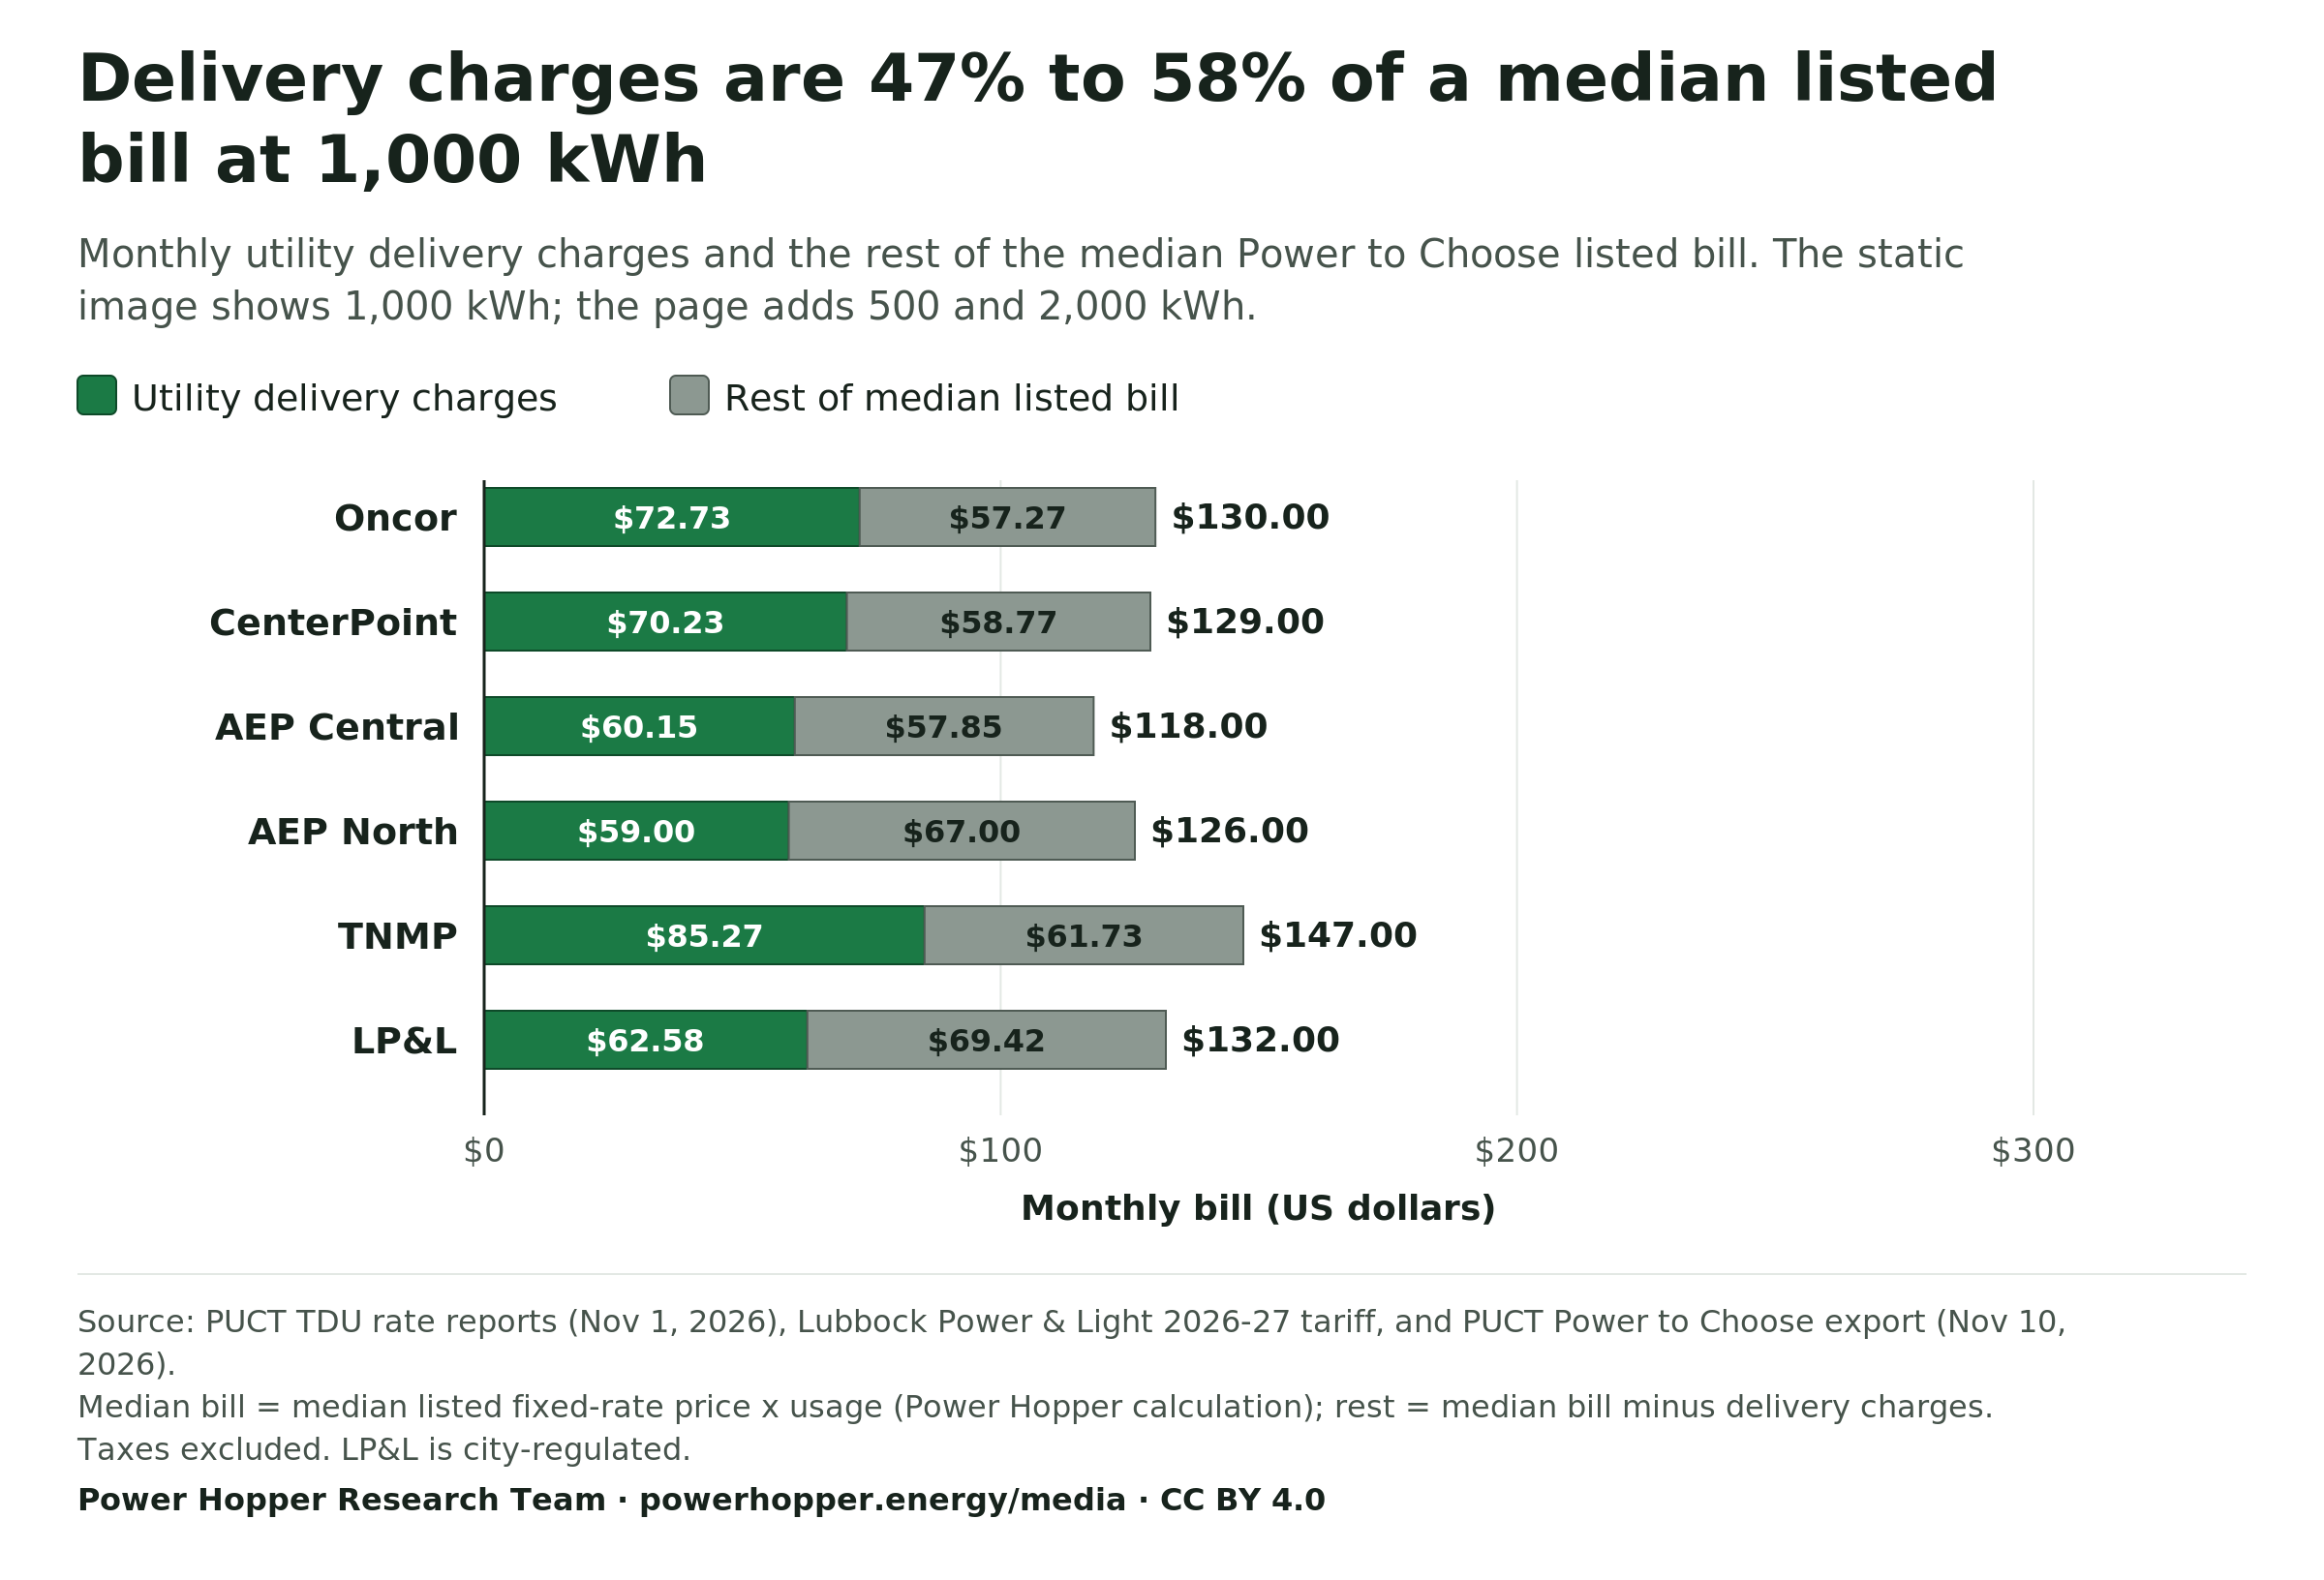
Delivery charges are 47% to 58% of a median listed bill at 1,000 kWh
Monthly utility delivery charges and the rest of the median Power to Choose listed bill. The static image shows 1,000 kWh; the page adds 500 and 2,000 kWh.
Utility delivery charges
Rest of median listed bill
At 500 kWh, delivery charges are 47% to 59% of the median listed bill.
Oncor
$38.40$30.60Bill $69.00
CenterPoint
$37.57$31.43Bill $69.00
AEP Central
$31.69$29.81Bill $61.50
AEP North
$31.12$35.38Bill $66.50
TNMP
$46.42$32.58Bill $79.00
LP&L
$32.54$36.96Bill $69.50
$0$100$200$300
Monthly bill (US dollars)
At 1,000 kWh, delivery charges are 47% to 58% of the median listed bill.
Oncor
$72.73$57.27Bill $130.00
CenterPoint
$70.23$58.77Bill $129.00
AEP Central
$60.15$57.85Bill $118.00
AEP North
$59.00$67.00Bill $126.00
TNMP
$85.27$61.73Bill $147.00
LP&L
$62.58$69.42Bill $132.00
$0$100$200$300
Monthly bill (US dollars)
At 2,000 kWh, delivery charges are 46% to 56% of the median listed bill.
Oncor
$141.41$116.59Bill $258.00
CenterPoint
$135.57$120.43Bill $256.00
AEP Central
$117.05$116.95Bill $234.00
AEP North
$114.76$135.24Bill $250.00
TNMP
$162.98$127.02Bill $290.00
LP&L
$122.66$145.34Bill $268.00
$0$100$200$300
Monthly bill (US dollars)
Source: PUCT TDU rate reports (Nov 1, 2026), Lubbock Power & Light 2026-27 tariff, and PUCT Power to Choose export (Nov 10, 2026). Median bill = median listed fixed-rate price x usage (Power Hopper calculation); rest = median bill minus delivery charges. Taxes excluded. LP&L is city-regulated.
Power Hopper Research Team. "Utility delivery charges vs the rest of the median listed bill, by utility (500, 1,000 and 2,000 kWh)." Chart. Texas Residential Delivery Charges by Utility dataset. Power Hopper Media Data Room, published November 10, 2026. https://powerhopper.energy/media/charts#chart-texas-median-listed-bill-delivery-vs-rest-1000-kwh-2026-11-10. Accessed [date accessed].
Data table
Utility delivery charges vs the rest of the median listed bill, by utility (500, 1,000 and 2,000 kWh) (Monthly bill (US dollars))
Delivery utility
500 kWh: Utility delivery charges
500 kWh: Rest of median listed bill
1,000 kWh: Utility delivery charges
1,000 kWh: Rest of median listed bill
2,000 kWh: Utility delivery charges
2,000 kWh: Rest of median listed bill
Oncor
$38.40
$30.60
$72.73
$57.27
$141.41
$116.59
CenterPoint
$37.57
$31.43
$70.23
$58.77
$135.57
$120.43
AEP Central
$31.69
$29.81
$60.15
$57.85
$117.05
$116.95
AEP North
$31.12
$35.38
$59.00
$67.00
$114.76
$135.24
TNMP
$46.42
$32.58
$85.27
$61.73
$162.98
$127.02
LP&L
$32.54
$36.96
$62.58
$69.42
$122.66
$145.34
Utility Delivery Charges · Sep 1 to Nov 1, 2026
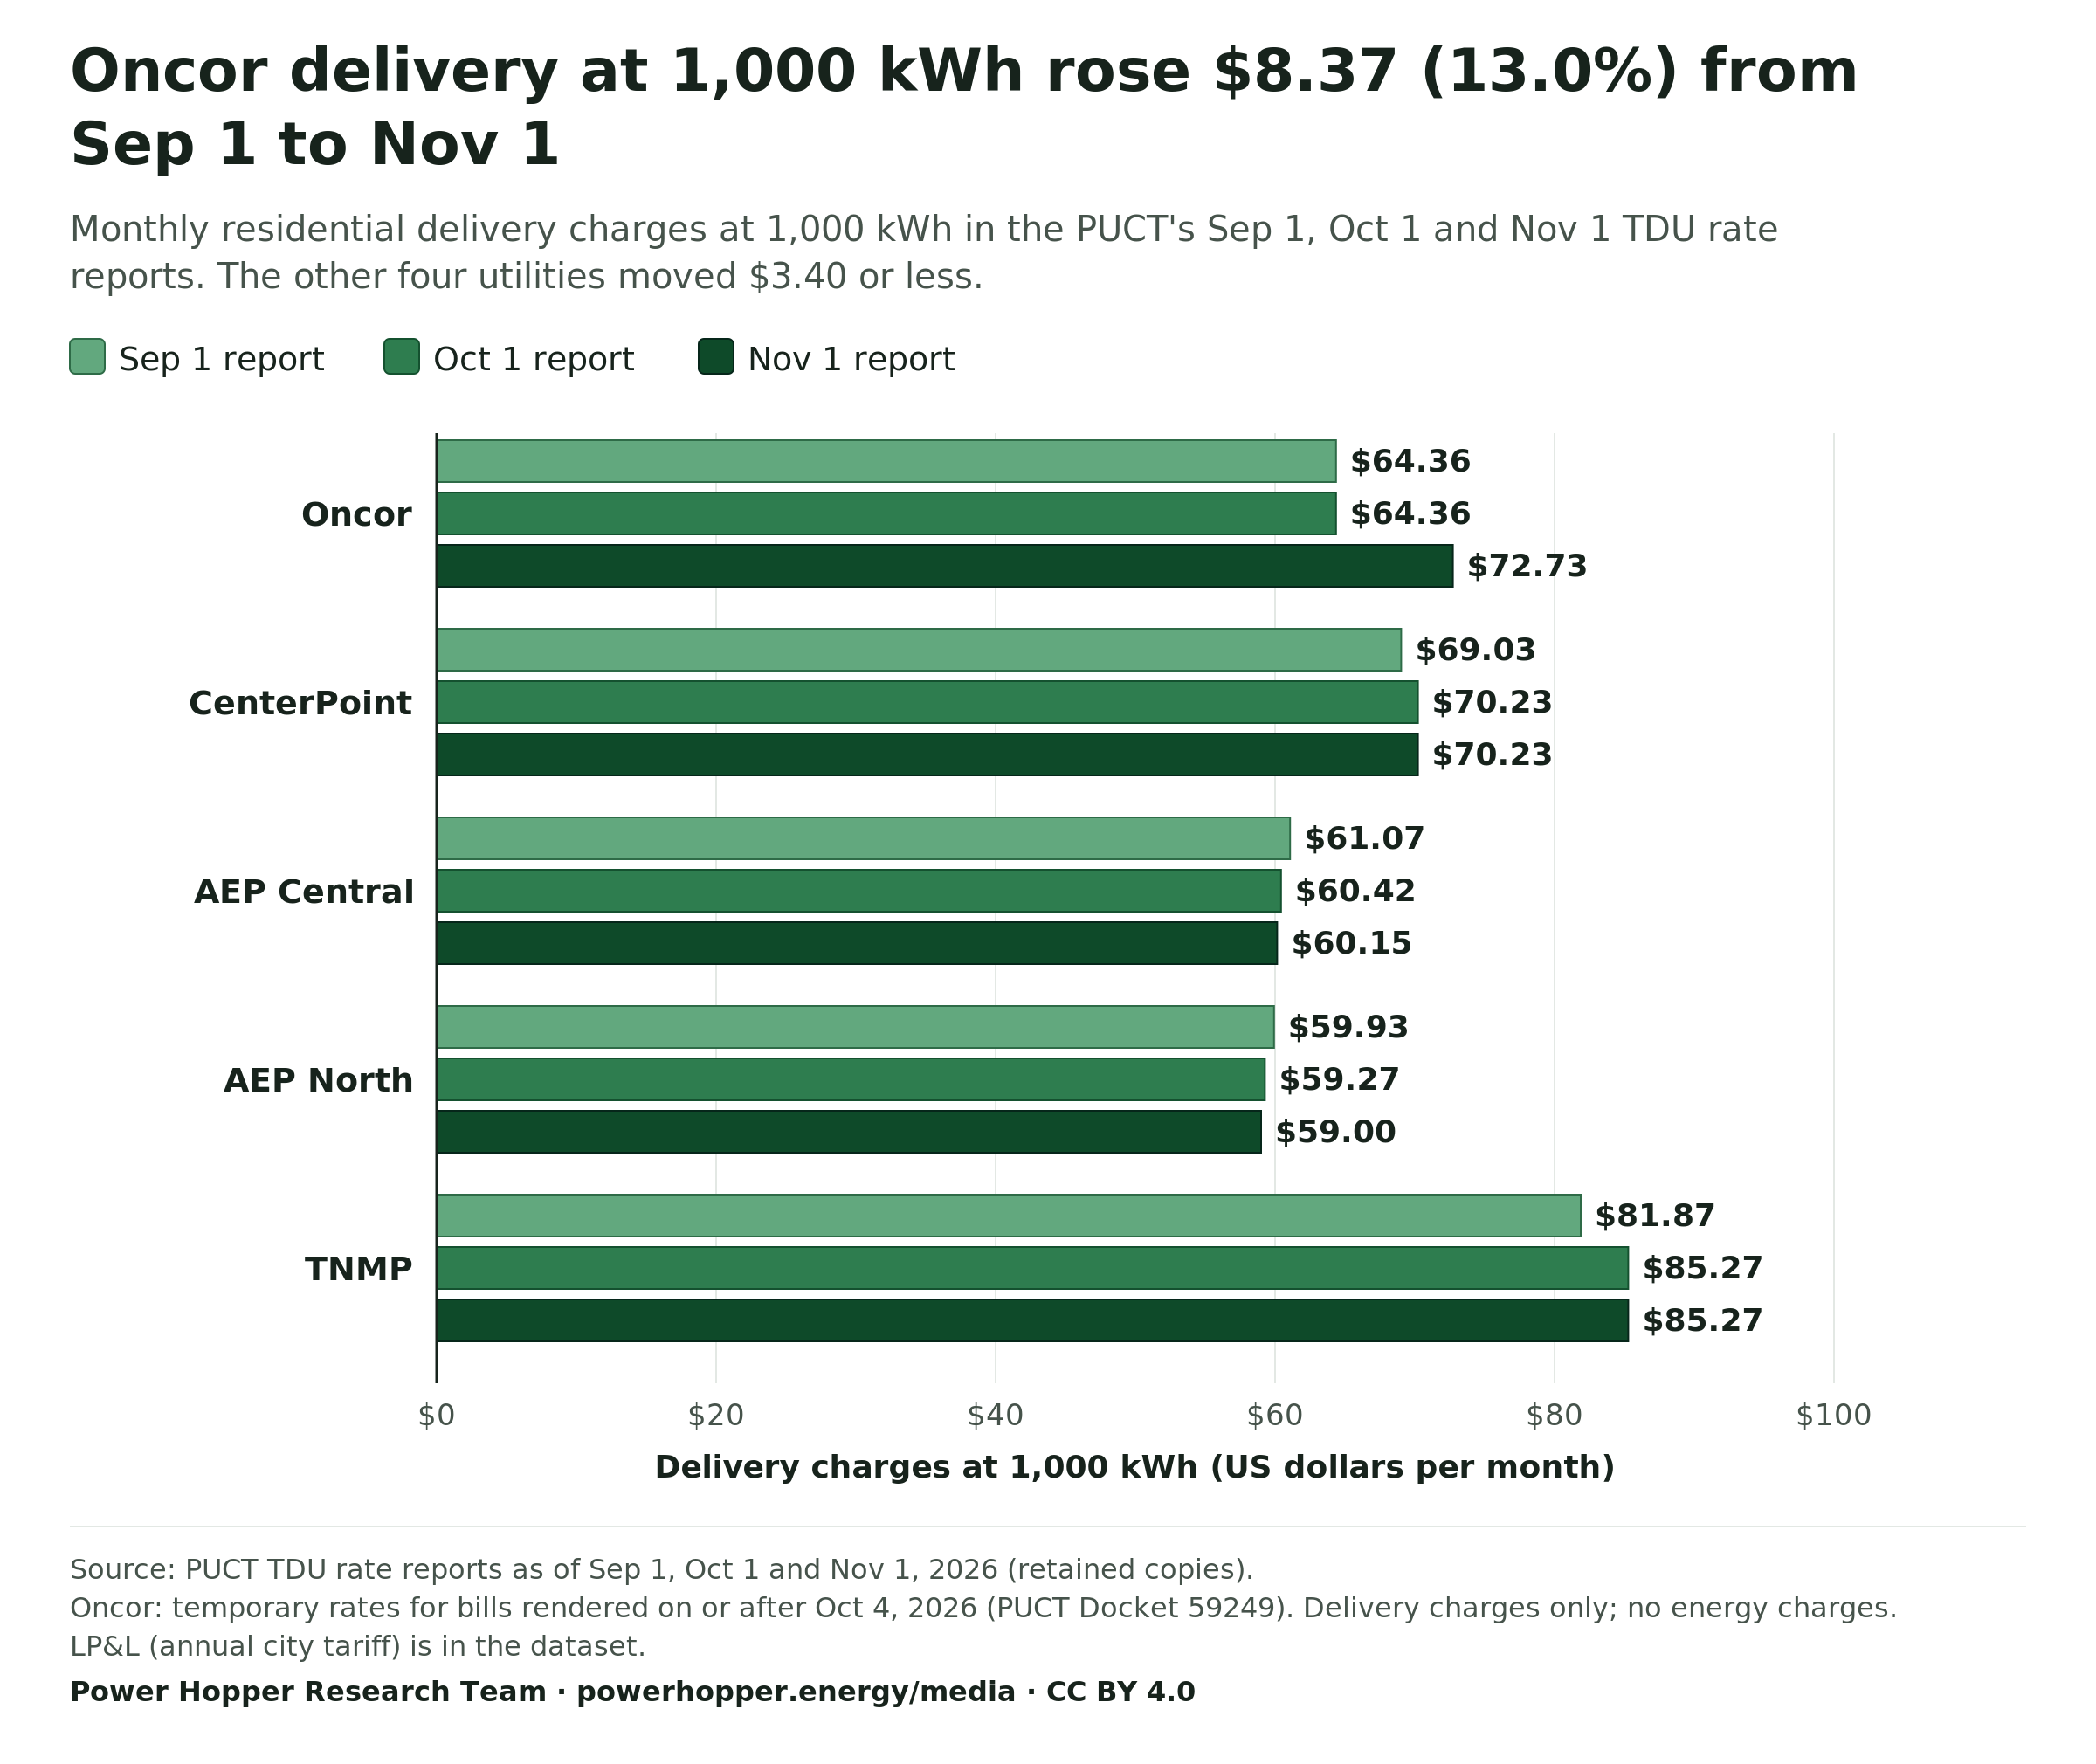
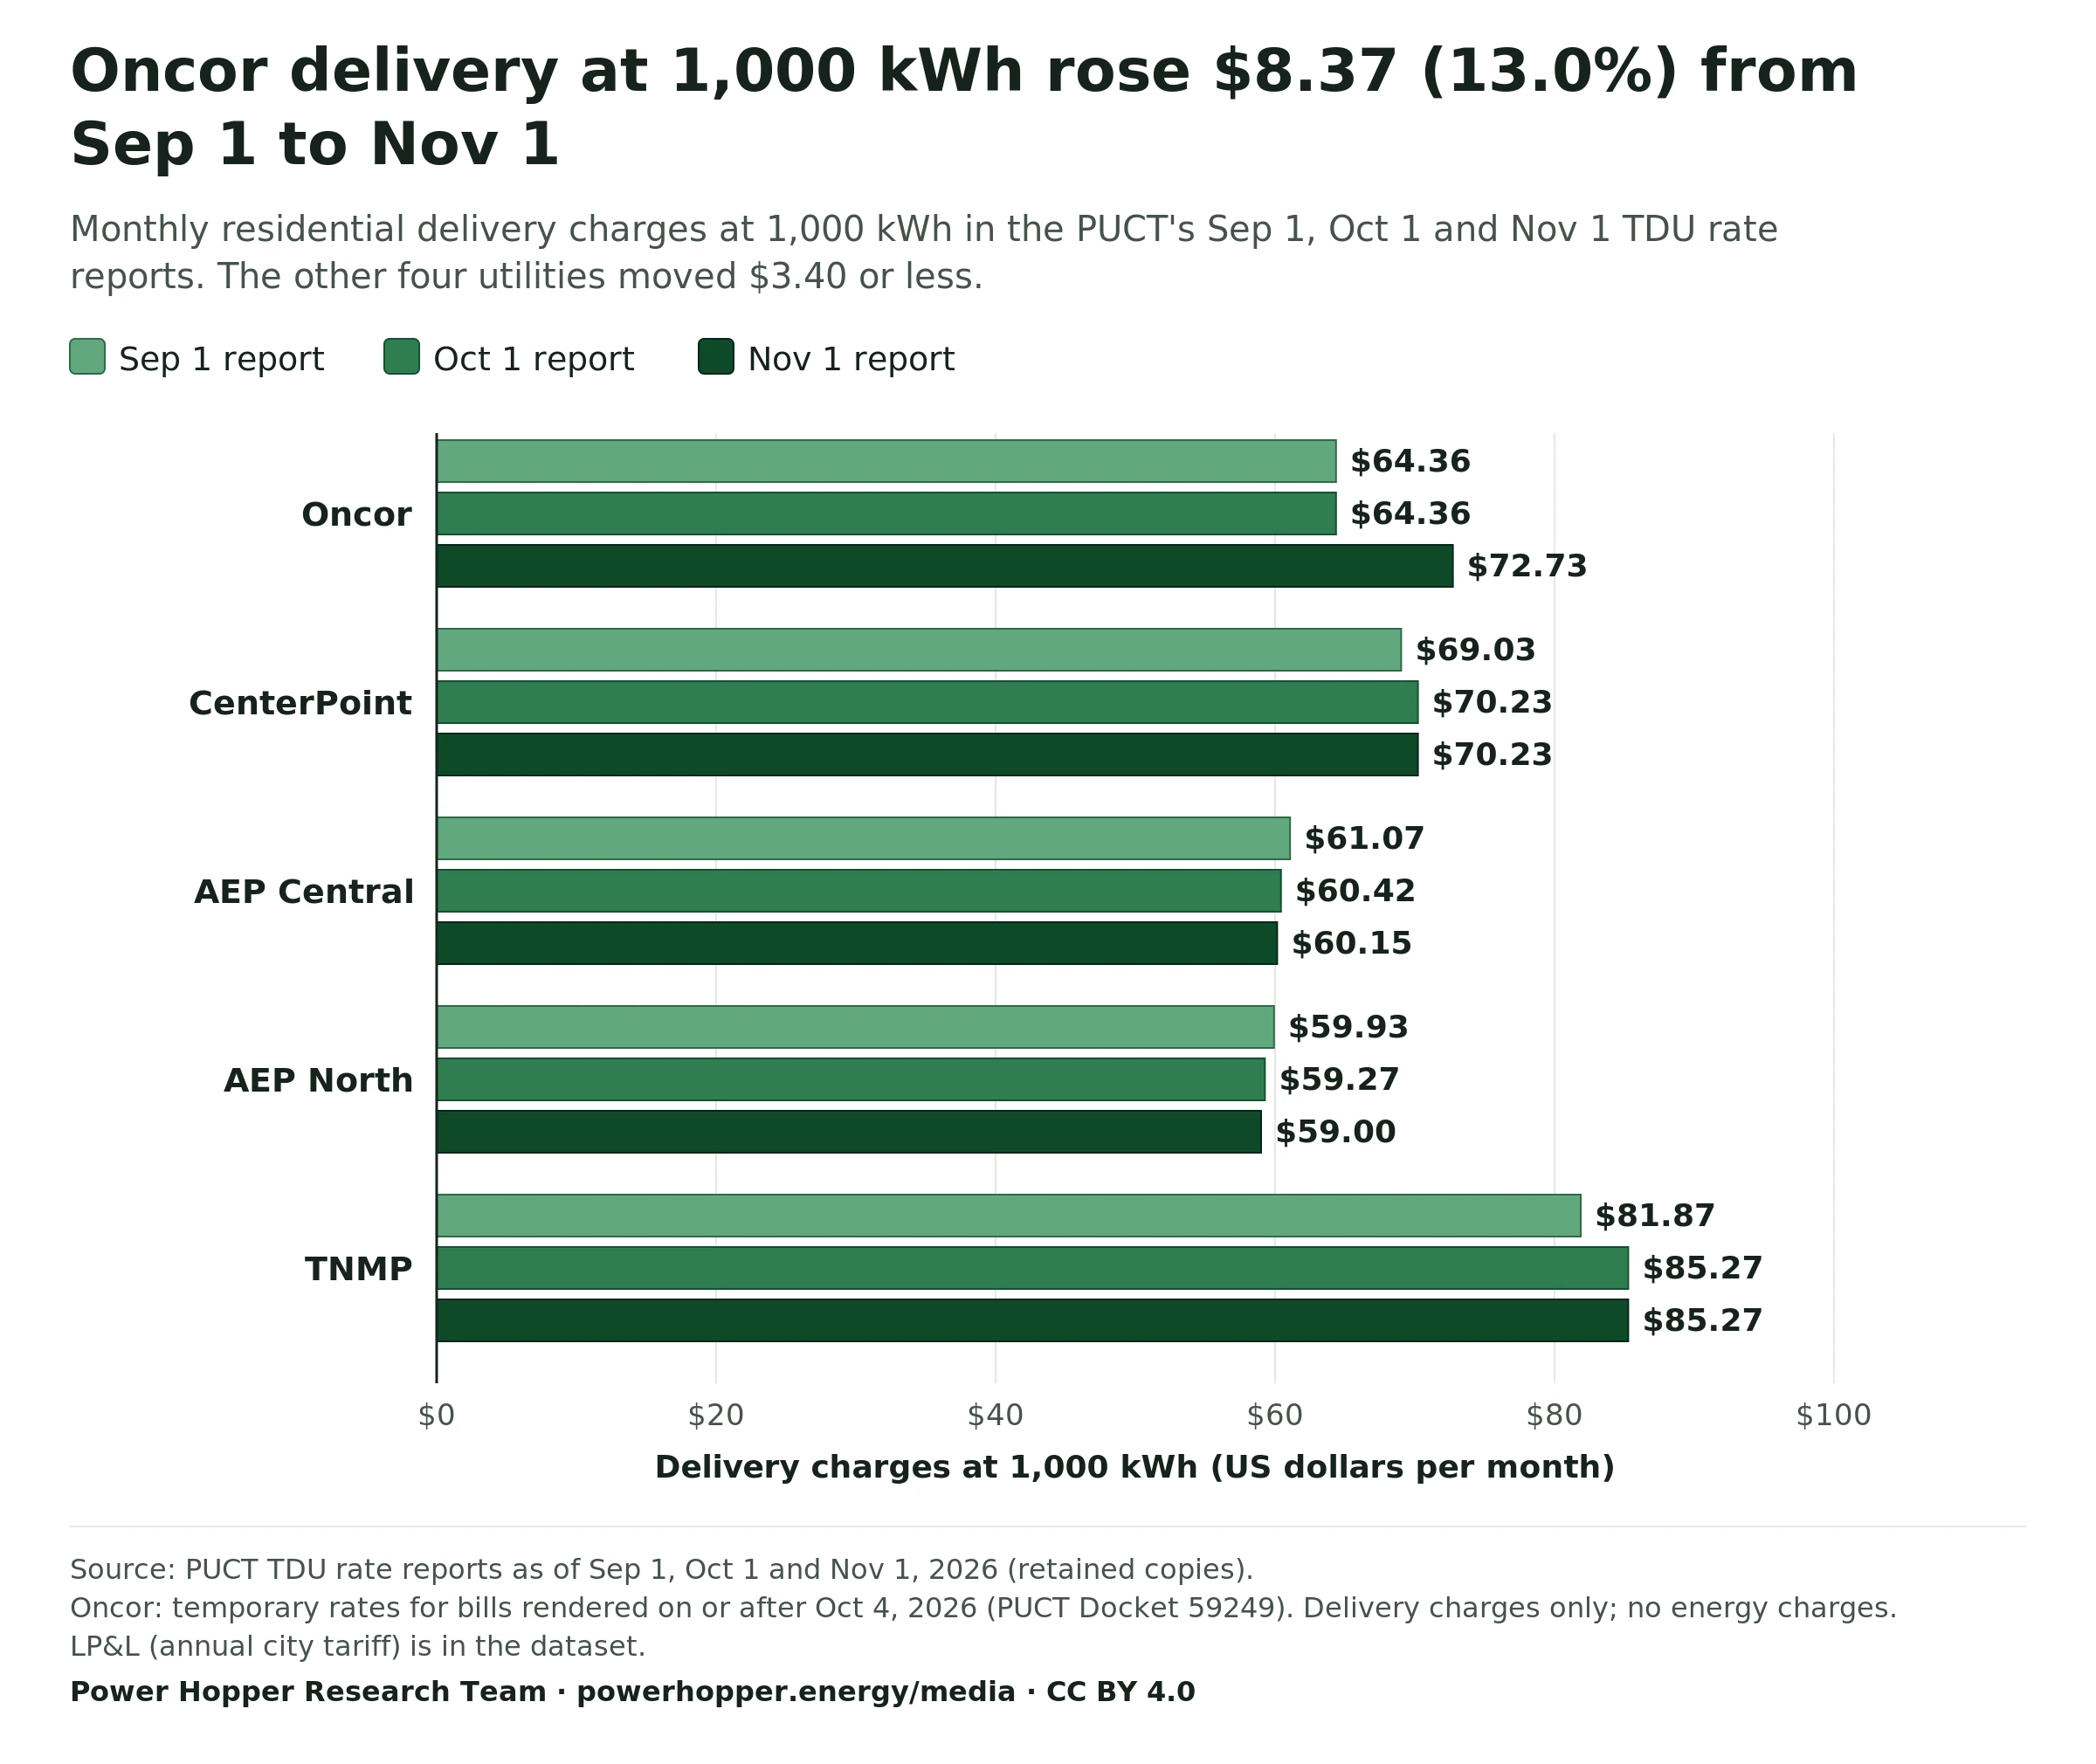
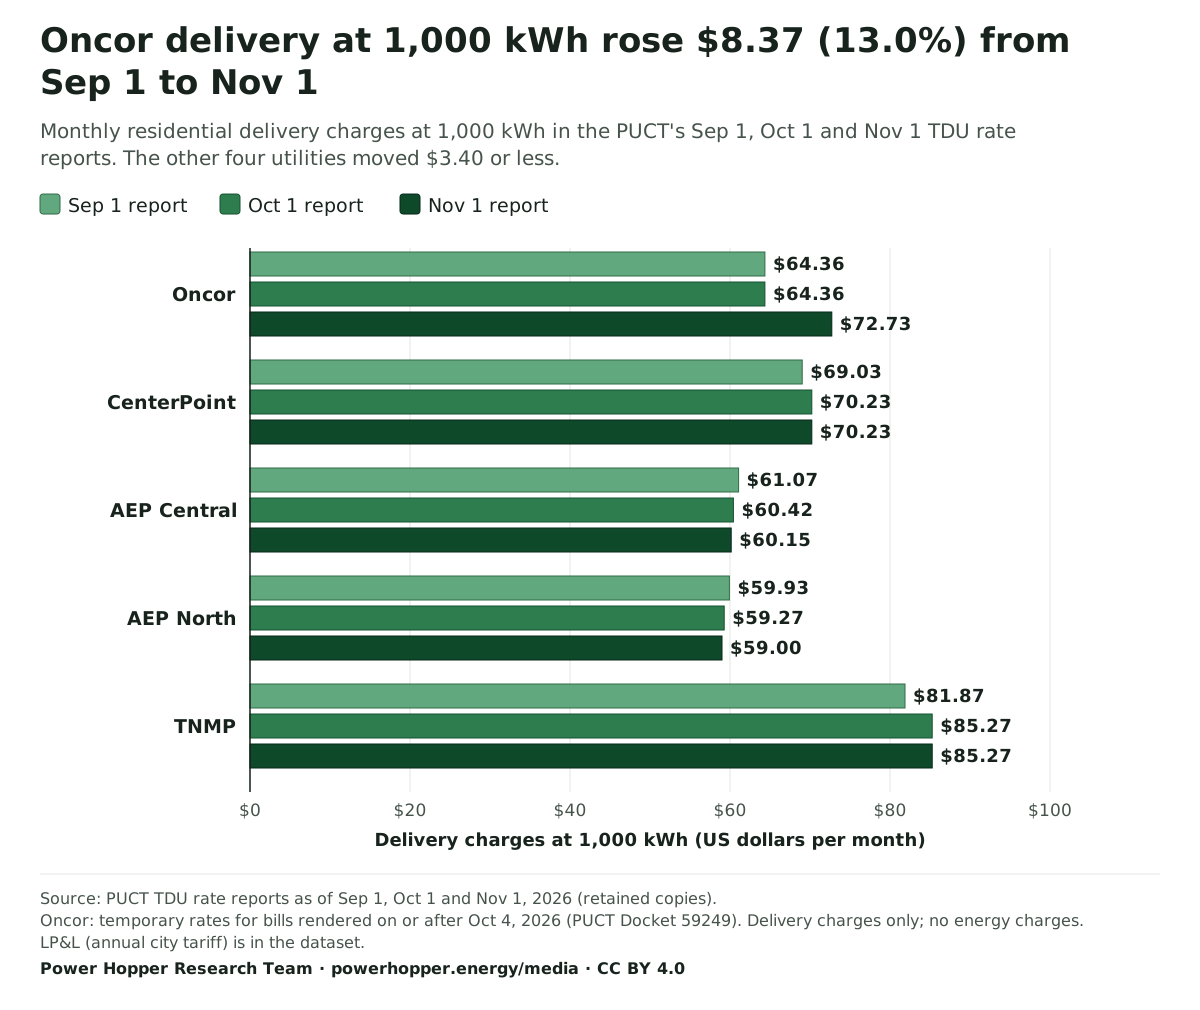
Oncor delivery at 1,000 kWh rose $8.37 (13.0%) from Sep 1 to Nov 1
Monthly residential delivery charges at 1,000 kWh in the PUCT's Sep 1, Oct 1 and Nov 1 TDU rate reports. The other four utilities moved $3.40 or less.
Sep 1 report
Oct 1 report
Nov 1 report
Oncor
Sep 1 report: $64.36
Oct 1 report: $64.36
Nov 1 report: $72.73
CenterPoint
Sep 1 report: $69.03
Oct 1 report: $70.23
Nov 1 report: $70.23
AEP Central
Sep 1 report: $61.07
Oct 1 report: $60.42
Nov 1 report: $60.15
AEP North
Sep 1 report: $59.93
Oct 1 report: $59.27
Nov 1 report: $59.00
TNMP
Sep 1 report: $81.87
Oct 1 report: $85.27
Nov 1 report: $85.27
$0$20$40$60$80$100
Delivery charges at 1,000 kWh (US dollars per month)
Source: PUCT TDU rate reports as of Sep 1, Oct 1 and Nov 1, 2026 (retained copies). Oncor: temporary rates for bills rendered on or after Oct 4, 2026 (PUCT Docket 59249). Delivery charges only; no energy charges. LP&L (annual city tariff) is in the dataset.
Power Hopper Research Team. "Residential delivery charges at 1,000 kWh, Sep to Nov 2026, by utility." Chart. Texas Residential Delivery Charge History, Sep to Nov 2026 dataset. Power Hopper Media Data Room, published November 10, 2026. https://powerhopper.energy/media/charts#chart-texas-residential-delivery-charges-1000-kwh-2026-09-to-2026-11. Accessed [date accessed].
Data table
Residential delivery charges at 1,000 kWh, Sep to Nov 2026, by utility (Delivery charges at 1,000 kWh (US dollars per month))
Delivery utility
Sep 1 report
Oct 1 report
Nov 1 report
Oncor
$64.36
$64.36
$72.73
CenterPoint
$69.03
$70.23
$70.23
AEP Central
$61.07
$60.42
$60.15
AEP North
$59.93
$59.27
$59.00
TNMP
$81.87
$85.27
$85.27
Charts
More charts
Plan Structure · Nov 10, 2026 snapshot
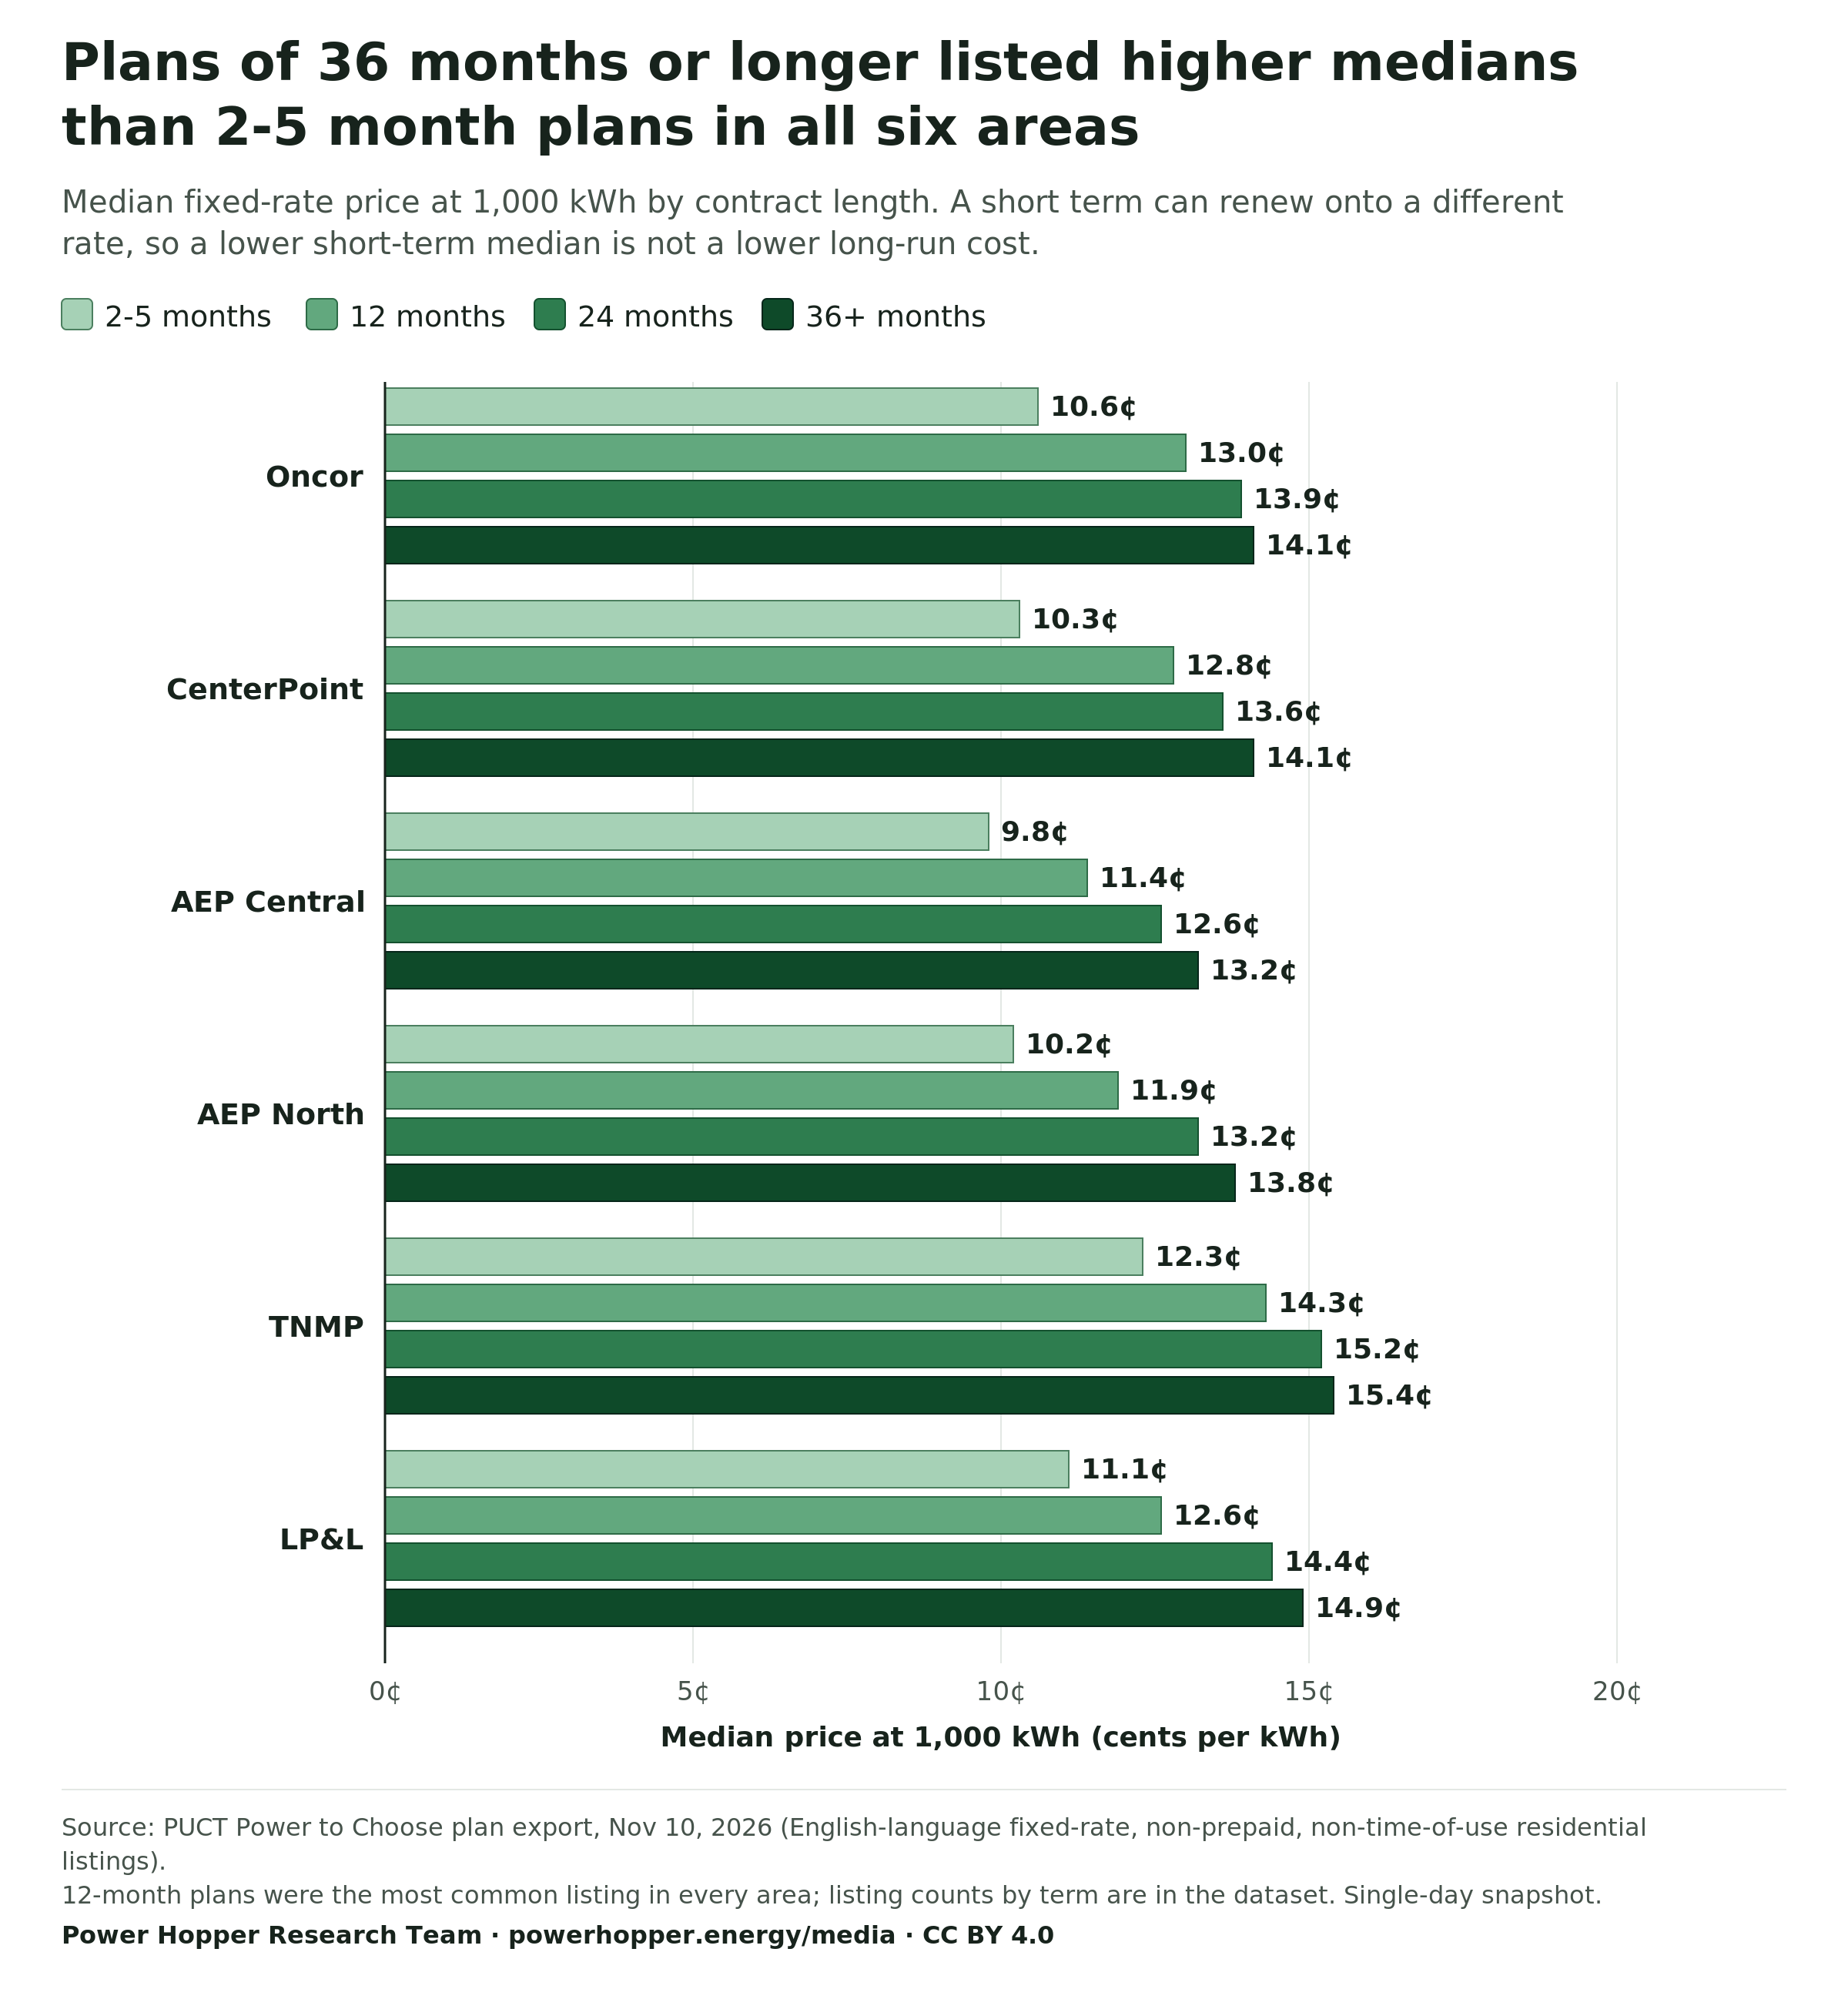
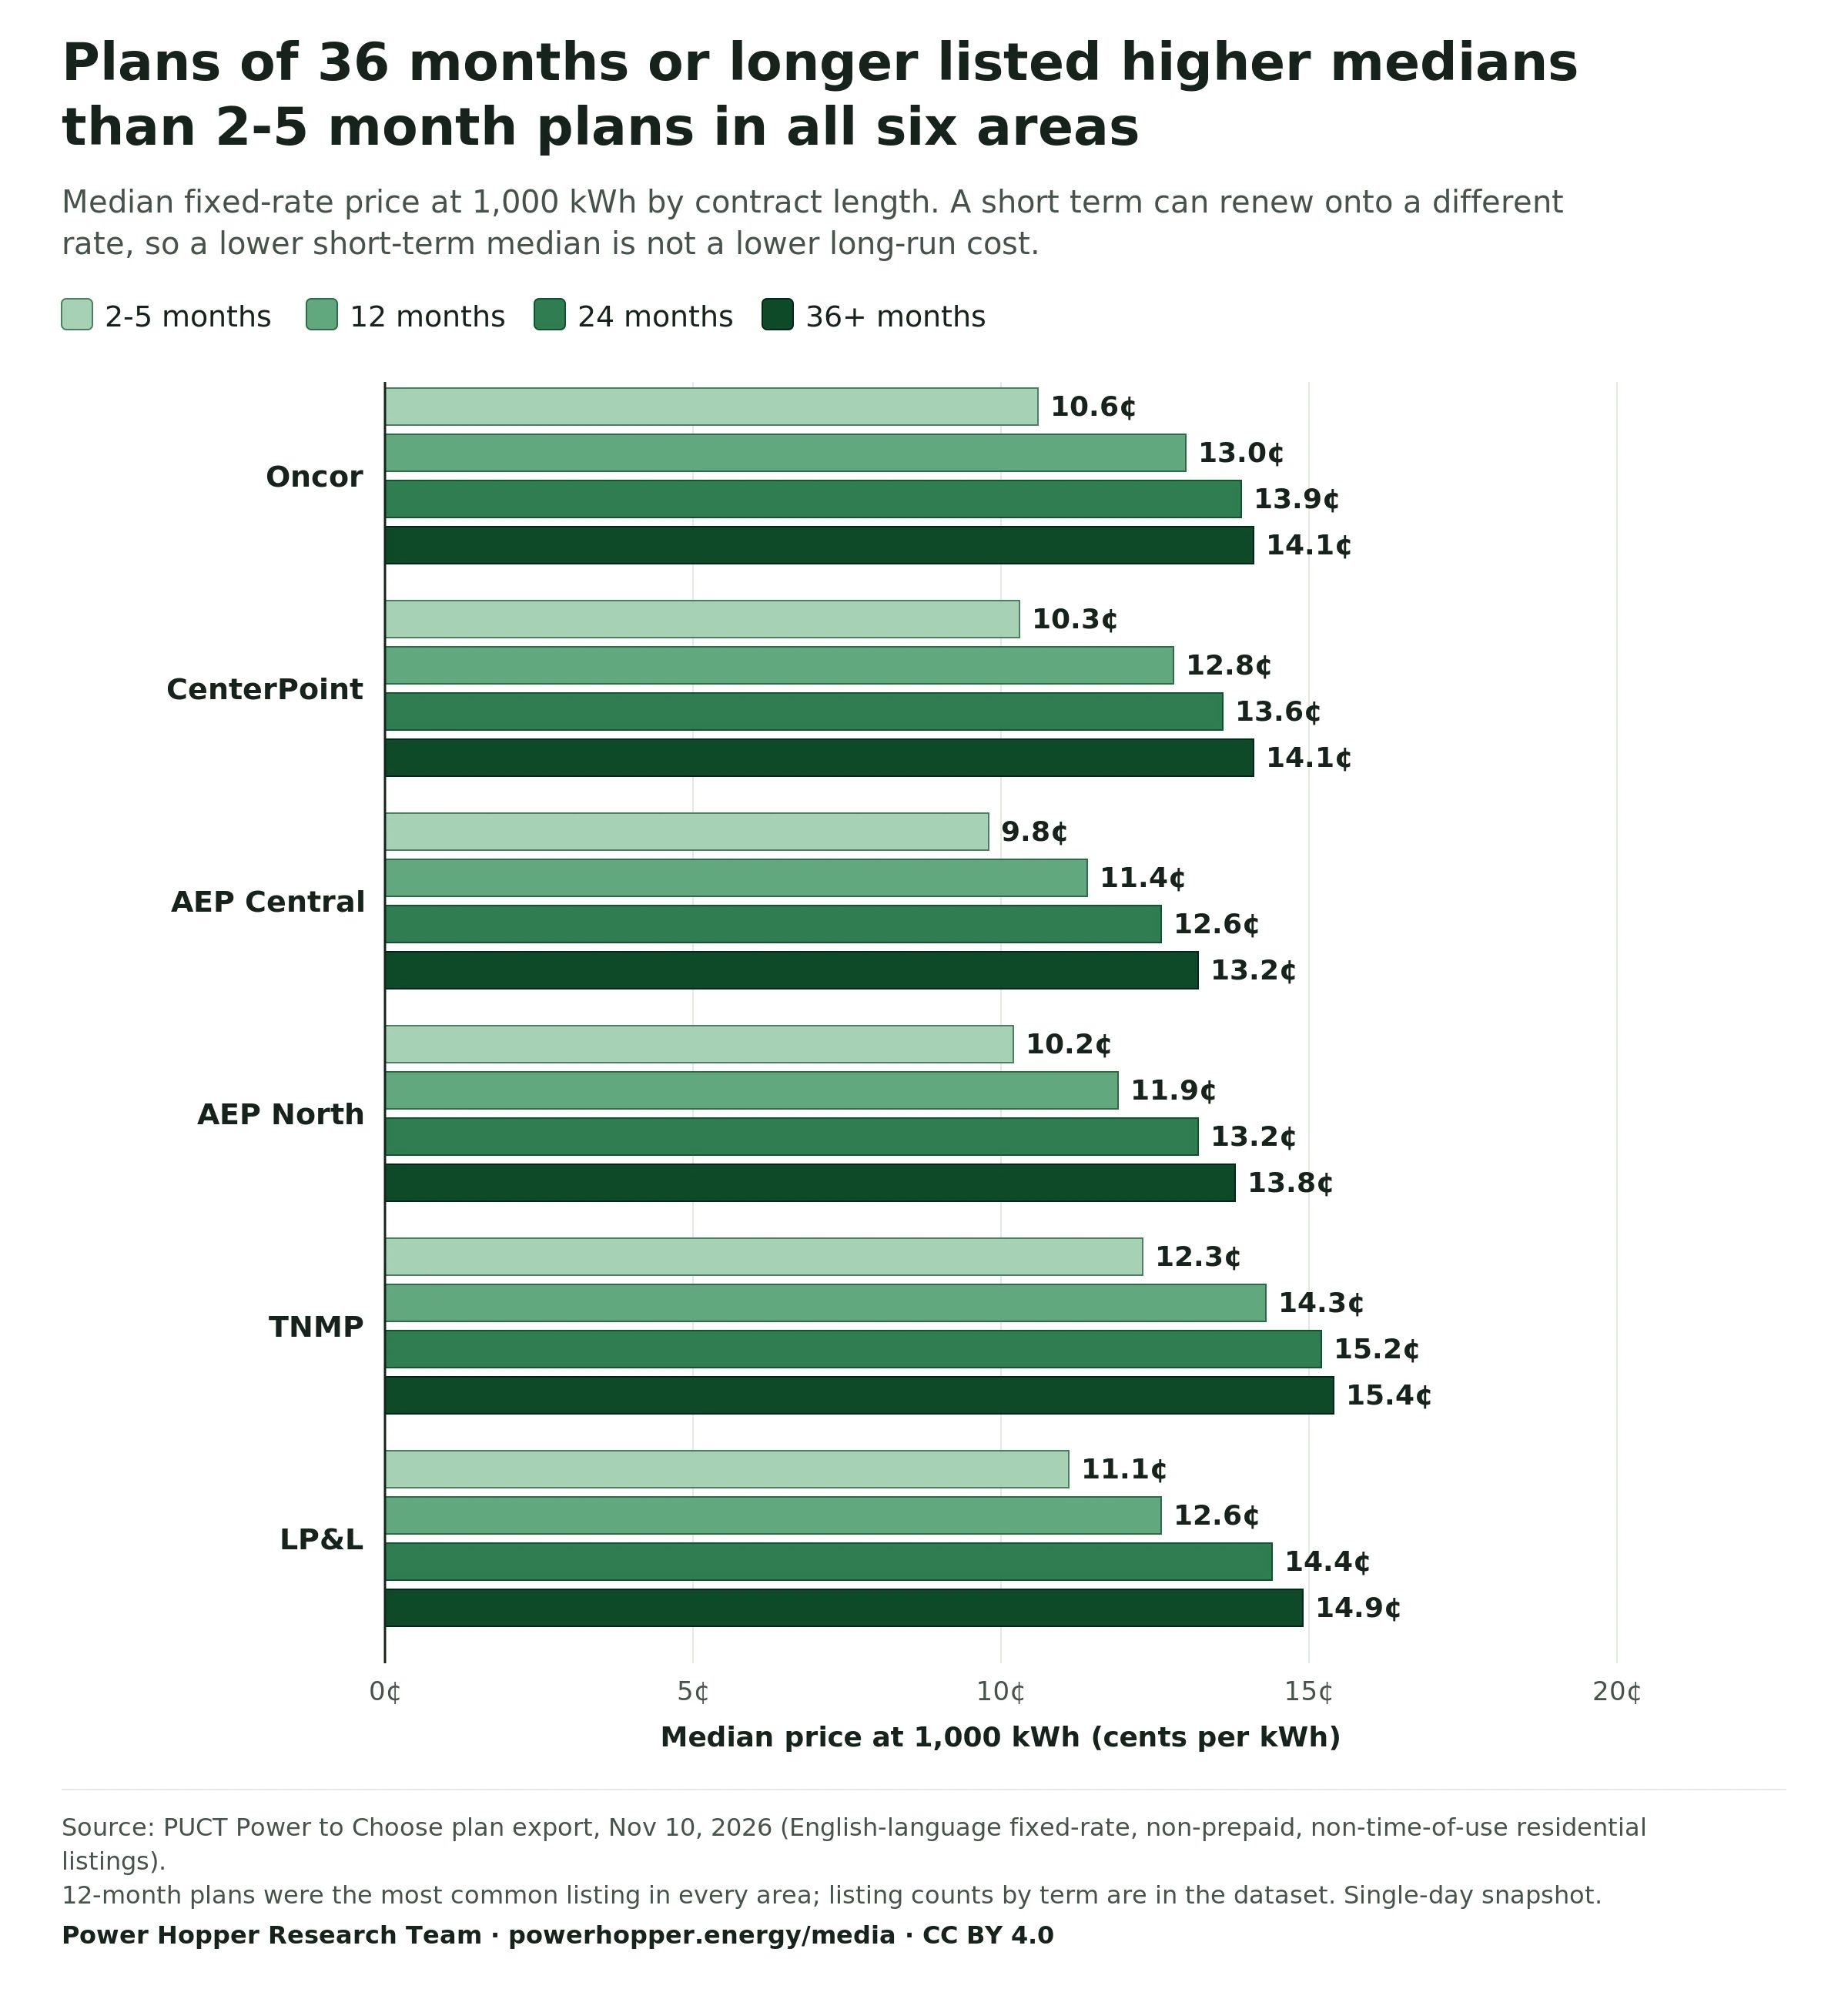
Plans of 36 months or longer listed higher medians than 2-5 month plans in all six areas
Median fixed-rate price at 1,000 kWh by contract length. A short term can renew onto a different rate, so a lower short-term median is not a lower long-run cost.
2-5 months
12 months
24 months
36+ months
Oncor
2-5 months: 10.6¢
12 months: 13.0¢
24 months: 13.9¢
36+ months: 14.1¢
CenterPoint
2-5 months: 10.3¢
12 months: 12.8¢
24 months: 13.6¢
36+ months: 14.1¢
AEP Central
2-5 months: 9.8¢
12 months: 11.4¢
24 months: 12.6¢
36+ months: 13.2¢
AEP North
2-5 months: 10.2¢
12 months: 11.9¢
24 months: 13.2¢
36+ months: 13.8¢
TNMP
2-5 months: 12.3¢
12 months: 14.3¢
24 months: 15.2¢
36+ months: 15.4¢
LP&L
2-5 months: 11.1¢
12 months: 12.6¢
24 months: 14.4¢
36+ months: 14.9¢
0¢5¢10¢15¢20¢
Median price at 1,000 kWh (cents per kWh)
Source: PUCT Power to Choose plan export, Nov 10, 2026 (English-language fixed-rate, non-prepaid, non-time-of-use residential listings). 12-month plans were the most common listing in every area; listing counts by term are in the dataset. Single-day snapshot.
Power Hopper Research Team. "Median fixed-plan price at 1,000 kWh by contract term and utility, Nov 10, 2026." Chart. Texas Electricity Plan Counts and Prices by Contract Term dataset. Power Hopper Media Data Room, published November 10, 2026. https://powerhopper.energy/media/charts#chart-texas-median-plan-price-by-contract-term-2026-11-10. Accessed [date accessed].
Data table
Median fixed-plan price at 1,000 kWh by contract term and utility, Nov 10, 2026 (Median price at 1,000 kWh (cents per kWh))
Delivery utility
2-5 months
12 months
24 months
36+ months
Oncor
10.6¢
13.0¢
13.9¢
14.1¢
CenterPoint
10.3¢
12.8¢
13.6¢
14.1¢
AEP Central
9.8¢
11.4¢
12.6¢
13.2¢
AEP North
10.2¢
11.9¢
13.2¢
13.8¢
TNMP
12.3¢
14.3¢
15.2¢
15.4¢
LP&L
11.1¢
12.6¢
14.4¢
14.9¢
Wholesale Market · Operating days Nov 2, 2026 to Nov 10, 2026
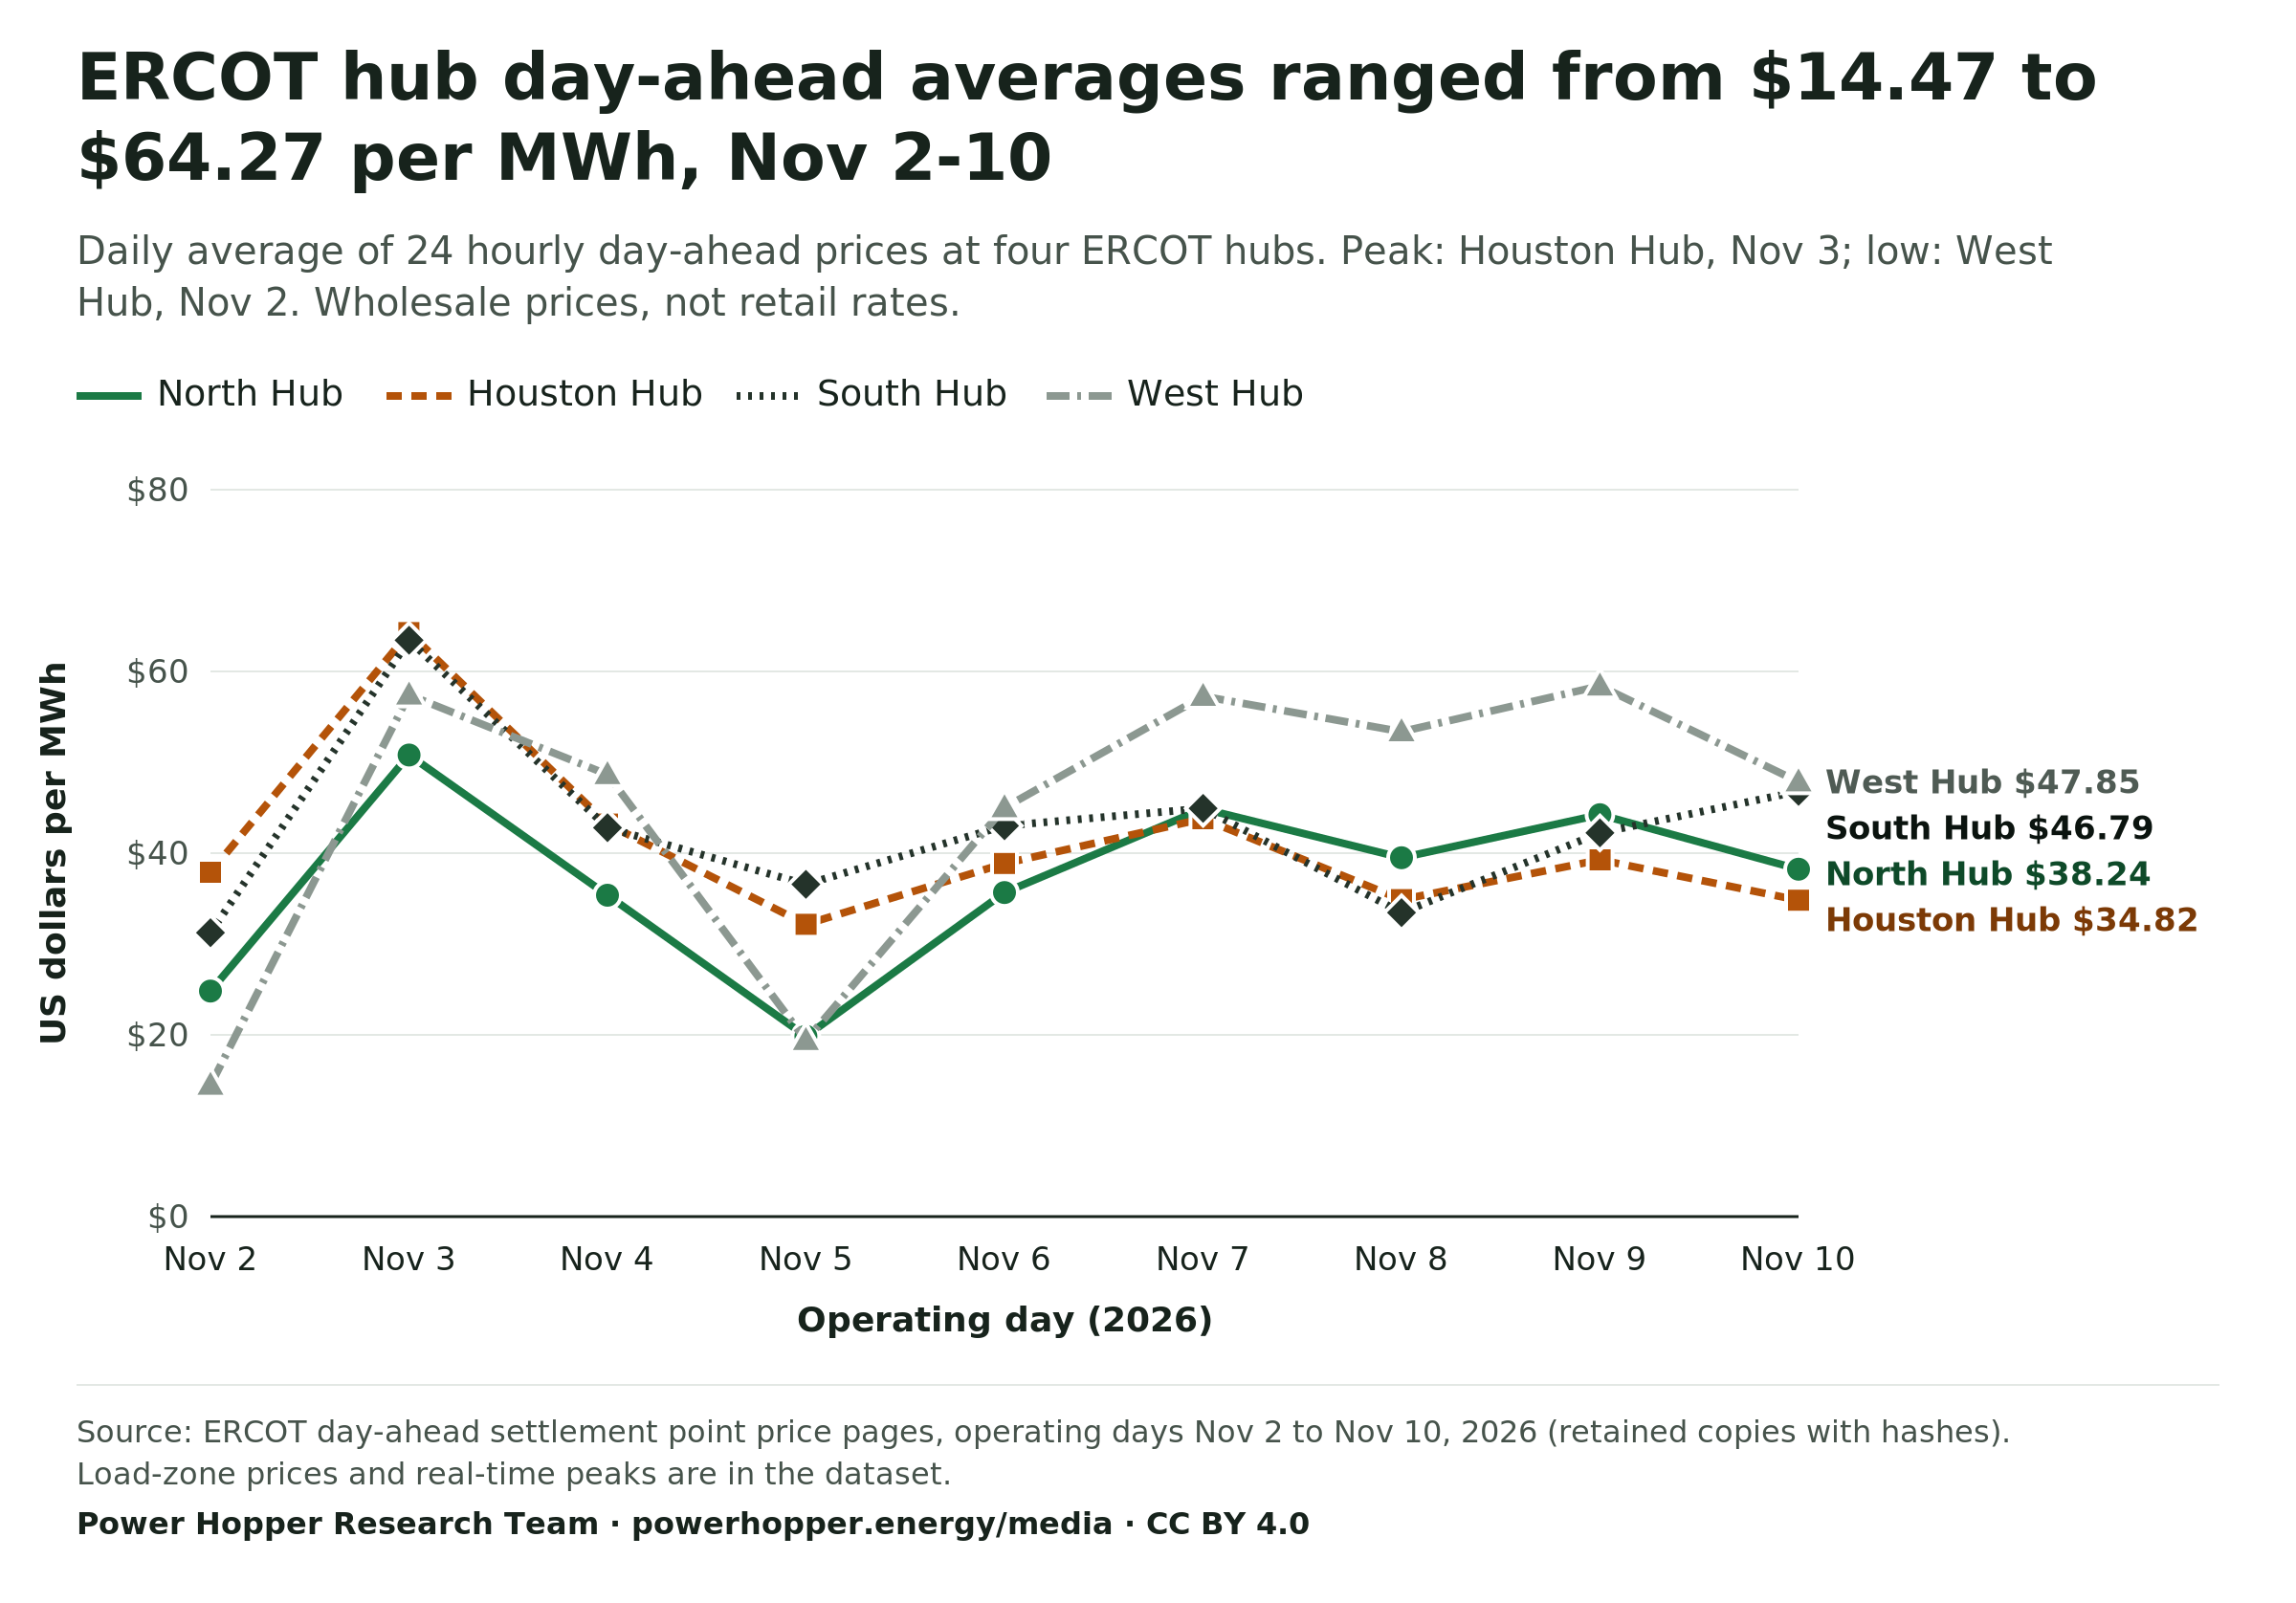
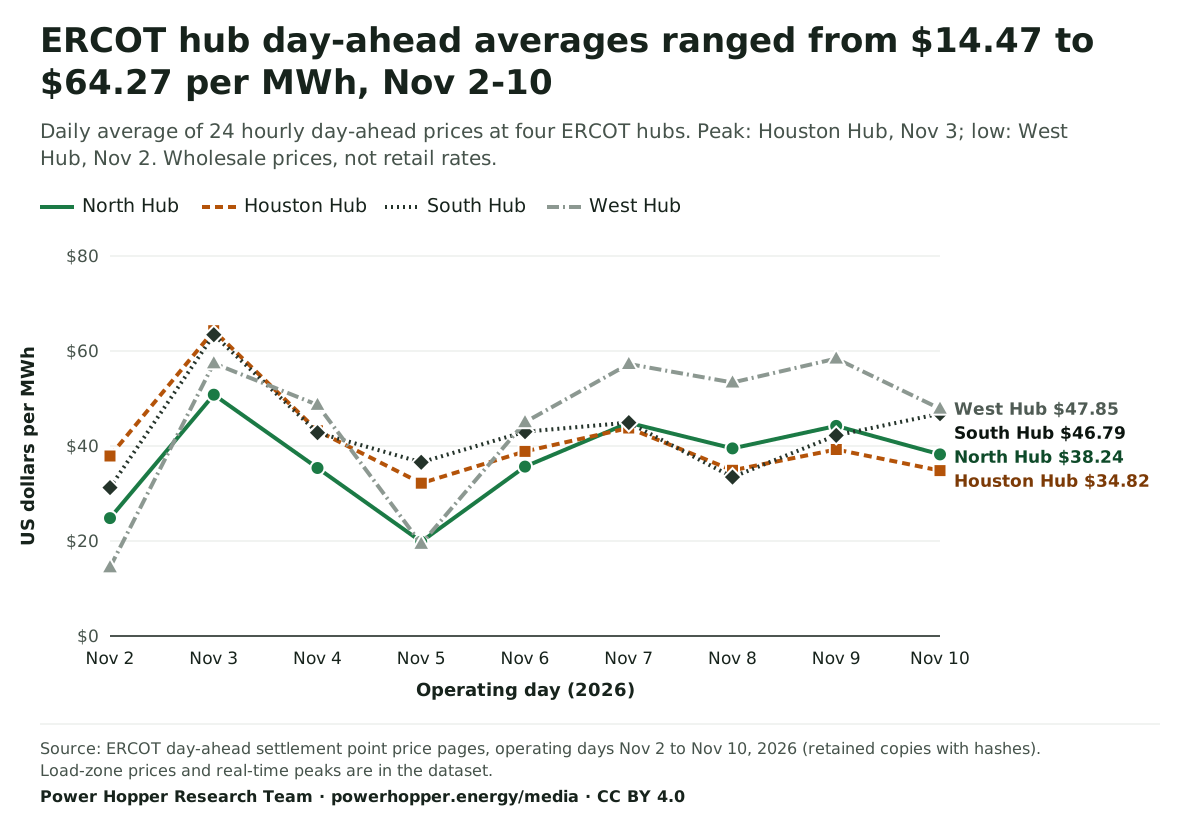
ERCOT hub day-ahead averages ranged from $14.47 to $64.27 per MWh, Nov 2-10
Daily average of 24 hourly day-ahead prices at four ERCOT hubs. Peak: Houston Hub, Nov 3; low: West Hub, Nov 2. Wholesale prices, not retail rates.
North Hub
Houston Hub
South Hub
West Hub
Source: ERCOT day-ahead settlement point price pages, operating days Nov 2 to Nov 10, 2026 (retained copies with hashes). Load-zone prices and real-time peaks are in the dataset.
Power Hopper Research Team. "ERCOT day-ahead daily average prices by hub, Nov 2 to Nov 10, 2026." Chart. ERCOT Daily Day-Ahead Hub and Load Zone Prices, Nov 2026 dataset. Power Hopper Media Data Room, published November 10, 2026. https://powerhopper.energy/media/charts#chart-ercot-day-ahead-daily-average-hub-prices-2026-11-02-to-2026-11-10. Accessed [date accessed].
Data table
ERCOT day-ahead daily average prices by hub, Nov 2 to Nov 10, 2026 (US dollars per MWh)
11.8–14.7¢range of utility medians at 1,000 kWh, Nov 10
Median advertised price of fixed-rate residential plans listed on Power to Choose, by delivery utility, at 500, 1,000 and 2,000 kWh, from dated snapshots.
Period
Snapshots of Nov 10, 2026 (current) and Oct 19, 2026 (historical)
How listed plans are built: share of fixed-rate plans with minimum-usage terms, medians with and without those terms, variable-rate listings and 100% renewable plan counts, by delivery utility.
$85.27TNMP delivery at 1,000 kWh, the highest of six
Monthly residential delivery charges at 500, 1,000 and 2,000 kWh for the five PUCT-regulated delivery utilities in competitive areas and for city-regulated Lubbock Power & Light, November 2026.
Period
Charges in effect for November 2026 (PUCT reports as of Nov 1, 2026; LP&L tariff effective Nov 1, 2026)
Residential delivery charges at 500, 1,000 and 2,000 kWh from the PUCT monthly reports of Sep 1, Oct 1 and Nov 1, 2026, plus Lubbock Power & Light's 2025-26 and 2026-27 tariffs.
Period
PUCT reports as of Sep 1, Oct 1 and Nov 1, 2026; LP&L tariffs effective Nov 1, 2025 and Nov 1, 2026
Daily average, minimum and maximum day-ahead settlement point prices for ERCOT hubs and load zones, plus real-time daily peaks for complete operating days, computed from ERCOT's public market pages.
Period
Operating days Nov 2-10, 2026 (day-ahead); Nov 4, 8 and 9, 2026 (real-time peaks)
38electricity-related measures of 1,262 filed Nov 9
Roster of electricity-related bills and joint resolutions filed on the first prefiling day for the 90th Texas Legislature, with Texas Legislature Online captions, authors, statuses and links. These are pending proposals, not law.
143 vs 44PUCT certificates vs Power to Choose brands
Two different provider counts that are often confused: retail electric provider certificates issued by the PUCT, and provider brand names listing plans on Power to Choose.
$124.82extra cost of using 999 kWh instead of 1,000 kWh
For EFL-verified plans with a $125 bill credit at 1,000 kWh, recalculated monthly bills at 999 and 1,000 kWh and average prices at 500, 1,000 and 2,000 kWh, by delivery utility.
Period
EFLs issued 2026-10-15 to 2026-10-28; listings observed 2026-10-21 to 2026-10-29
How far the lowest advertised 1,000 kWh price sits below the median, how much of that gap comes from usage-sensitive plans, and what the lowest-priced plan costs at 500 kWh, by delivery utility (Nov 10, 2026).
10.6¢ vs 14.1¢Oncor median, 2-5 month vs 36+ month terms
Number of residential plan listings on Power to Choose by contract length and delivery utility, with the median fixed-rate price at 1,000 kWh for each term group (Nov 10, 2026).
80 of 94distinct EFL records verified and reconciled
How many records in two third-party plan listing files carry Electricity Facts Label components, how many are EFL-verified, and how many reproduce the published prices when recalculated.
Period
Records dated Sep 20 to Nov 2, 2026; audit run Nov 10, 2026
No datasets match. Clear the search or choose All topics.
Utility Regulation and Legislation
Pending proposals
38 electricity-related measures were filed Nov 9, 2026 for the 90th Texas Legislature. All are proposals, not law. Impact analysis: Analysis pending review. View the roster.
Enacted law
No enacted-law resources are published in this release.
Coming soon
Weekly plan price series by utility
Delivery tariff reconciliation notes
Reviewed analysis of the Nov 2026 legislative filings
Utility Regulation and Legislation · Filed Nov 9, 2026; statuses as of Nov 10, 2026
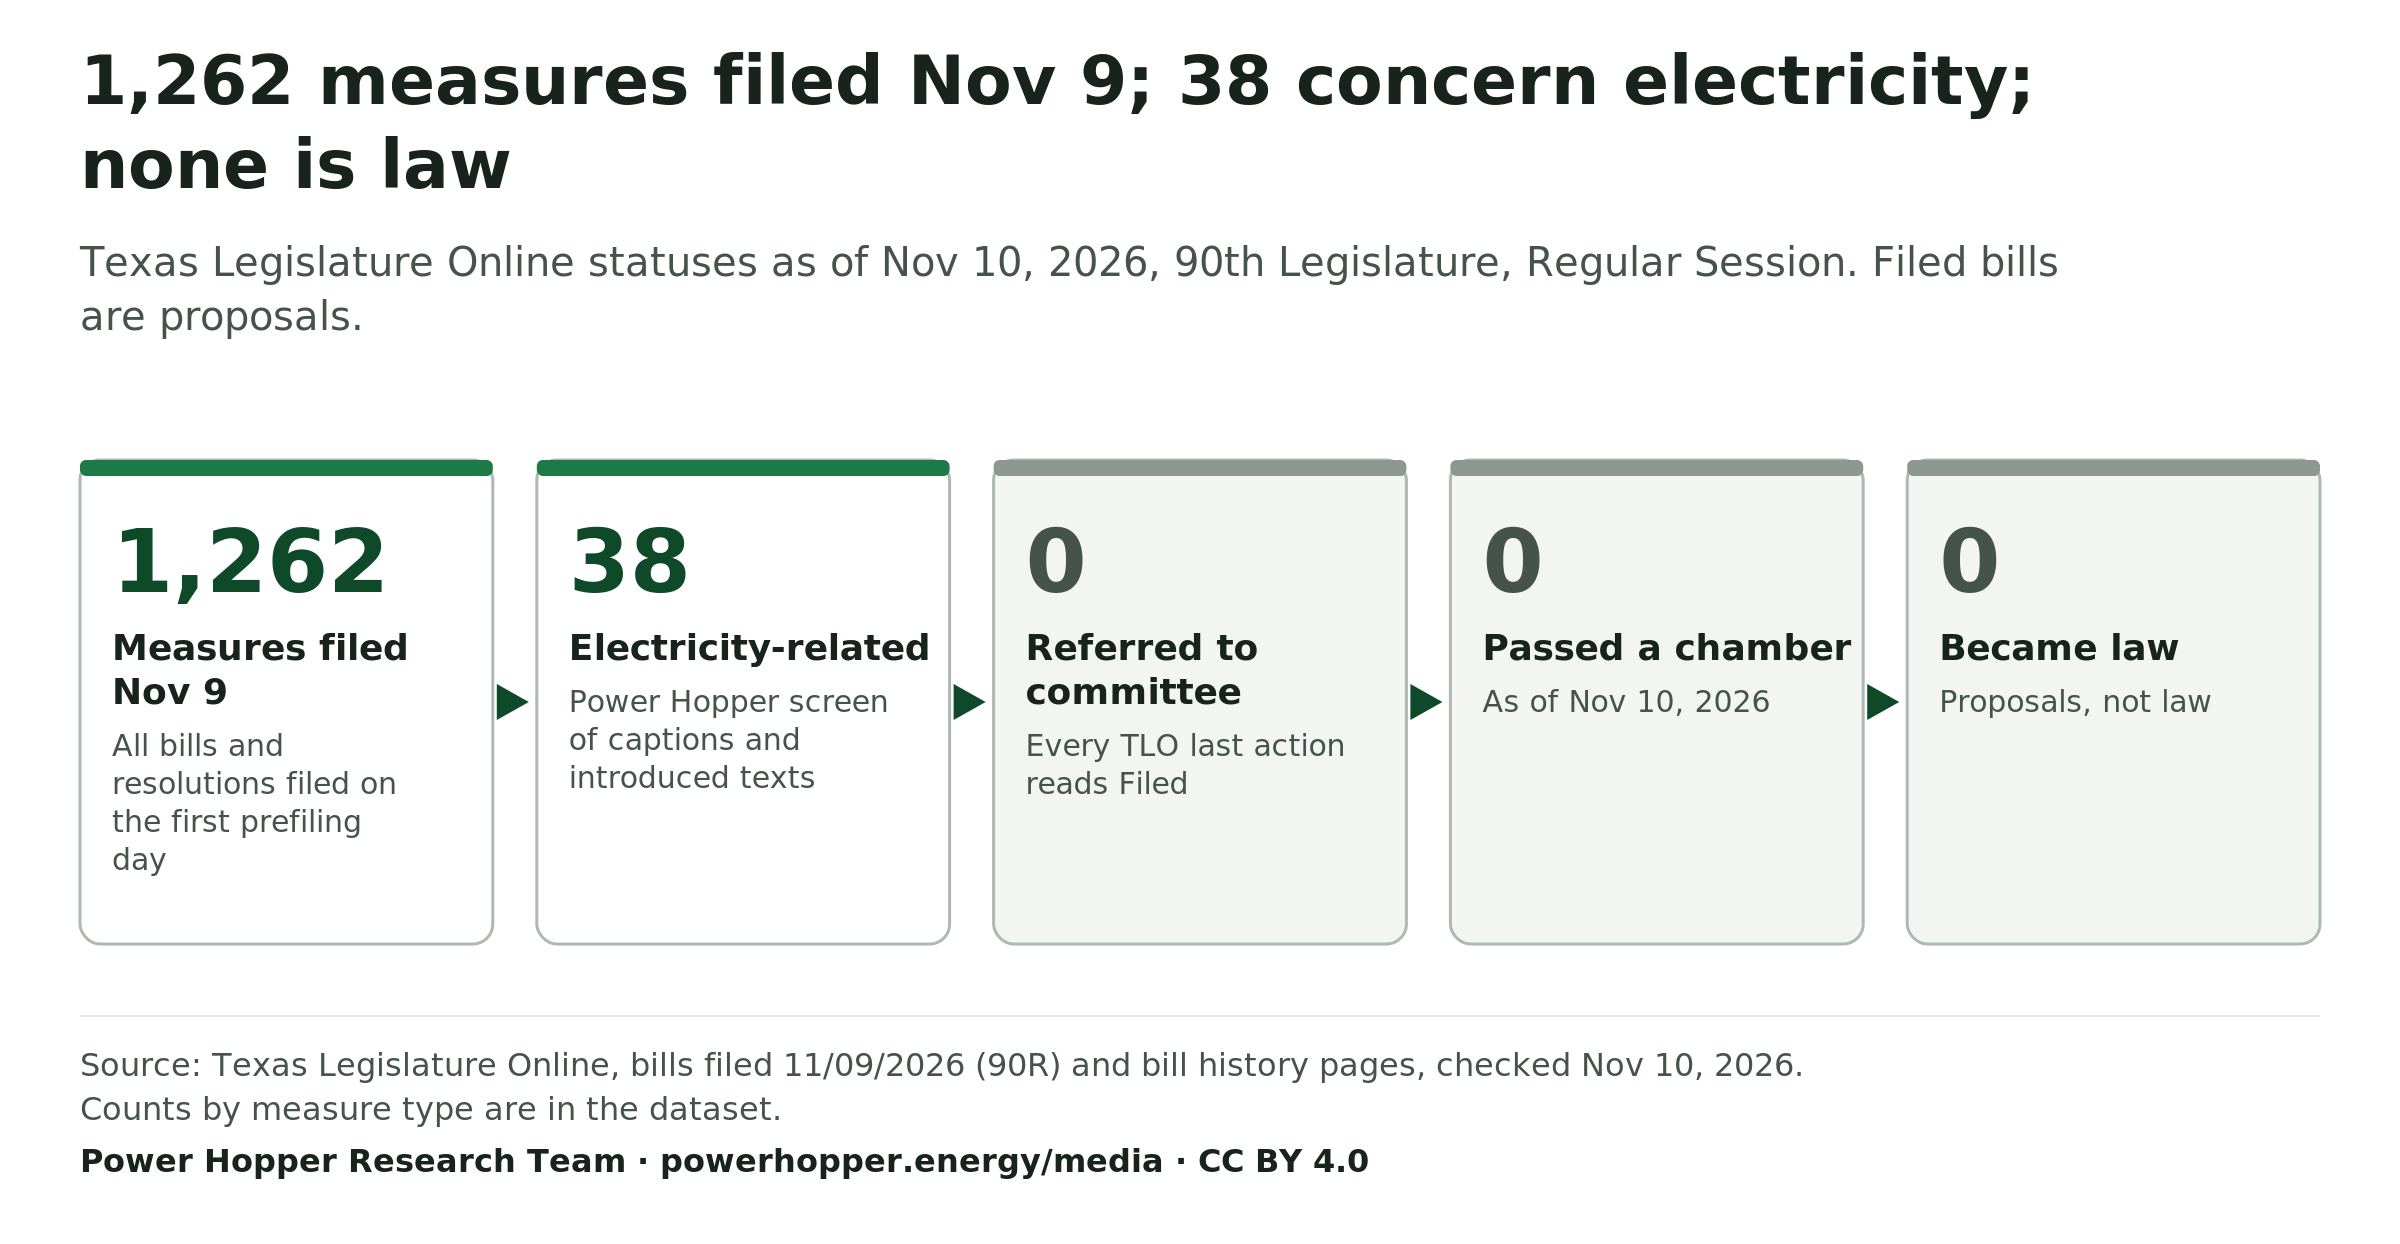
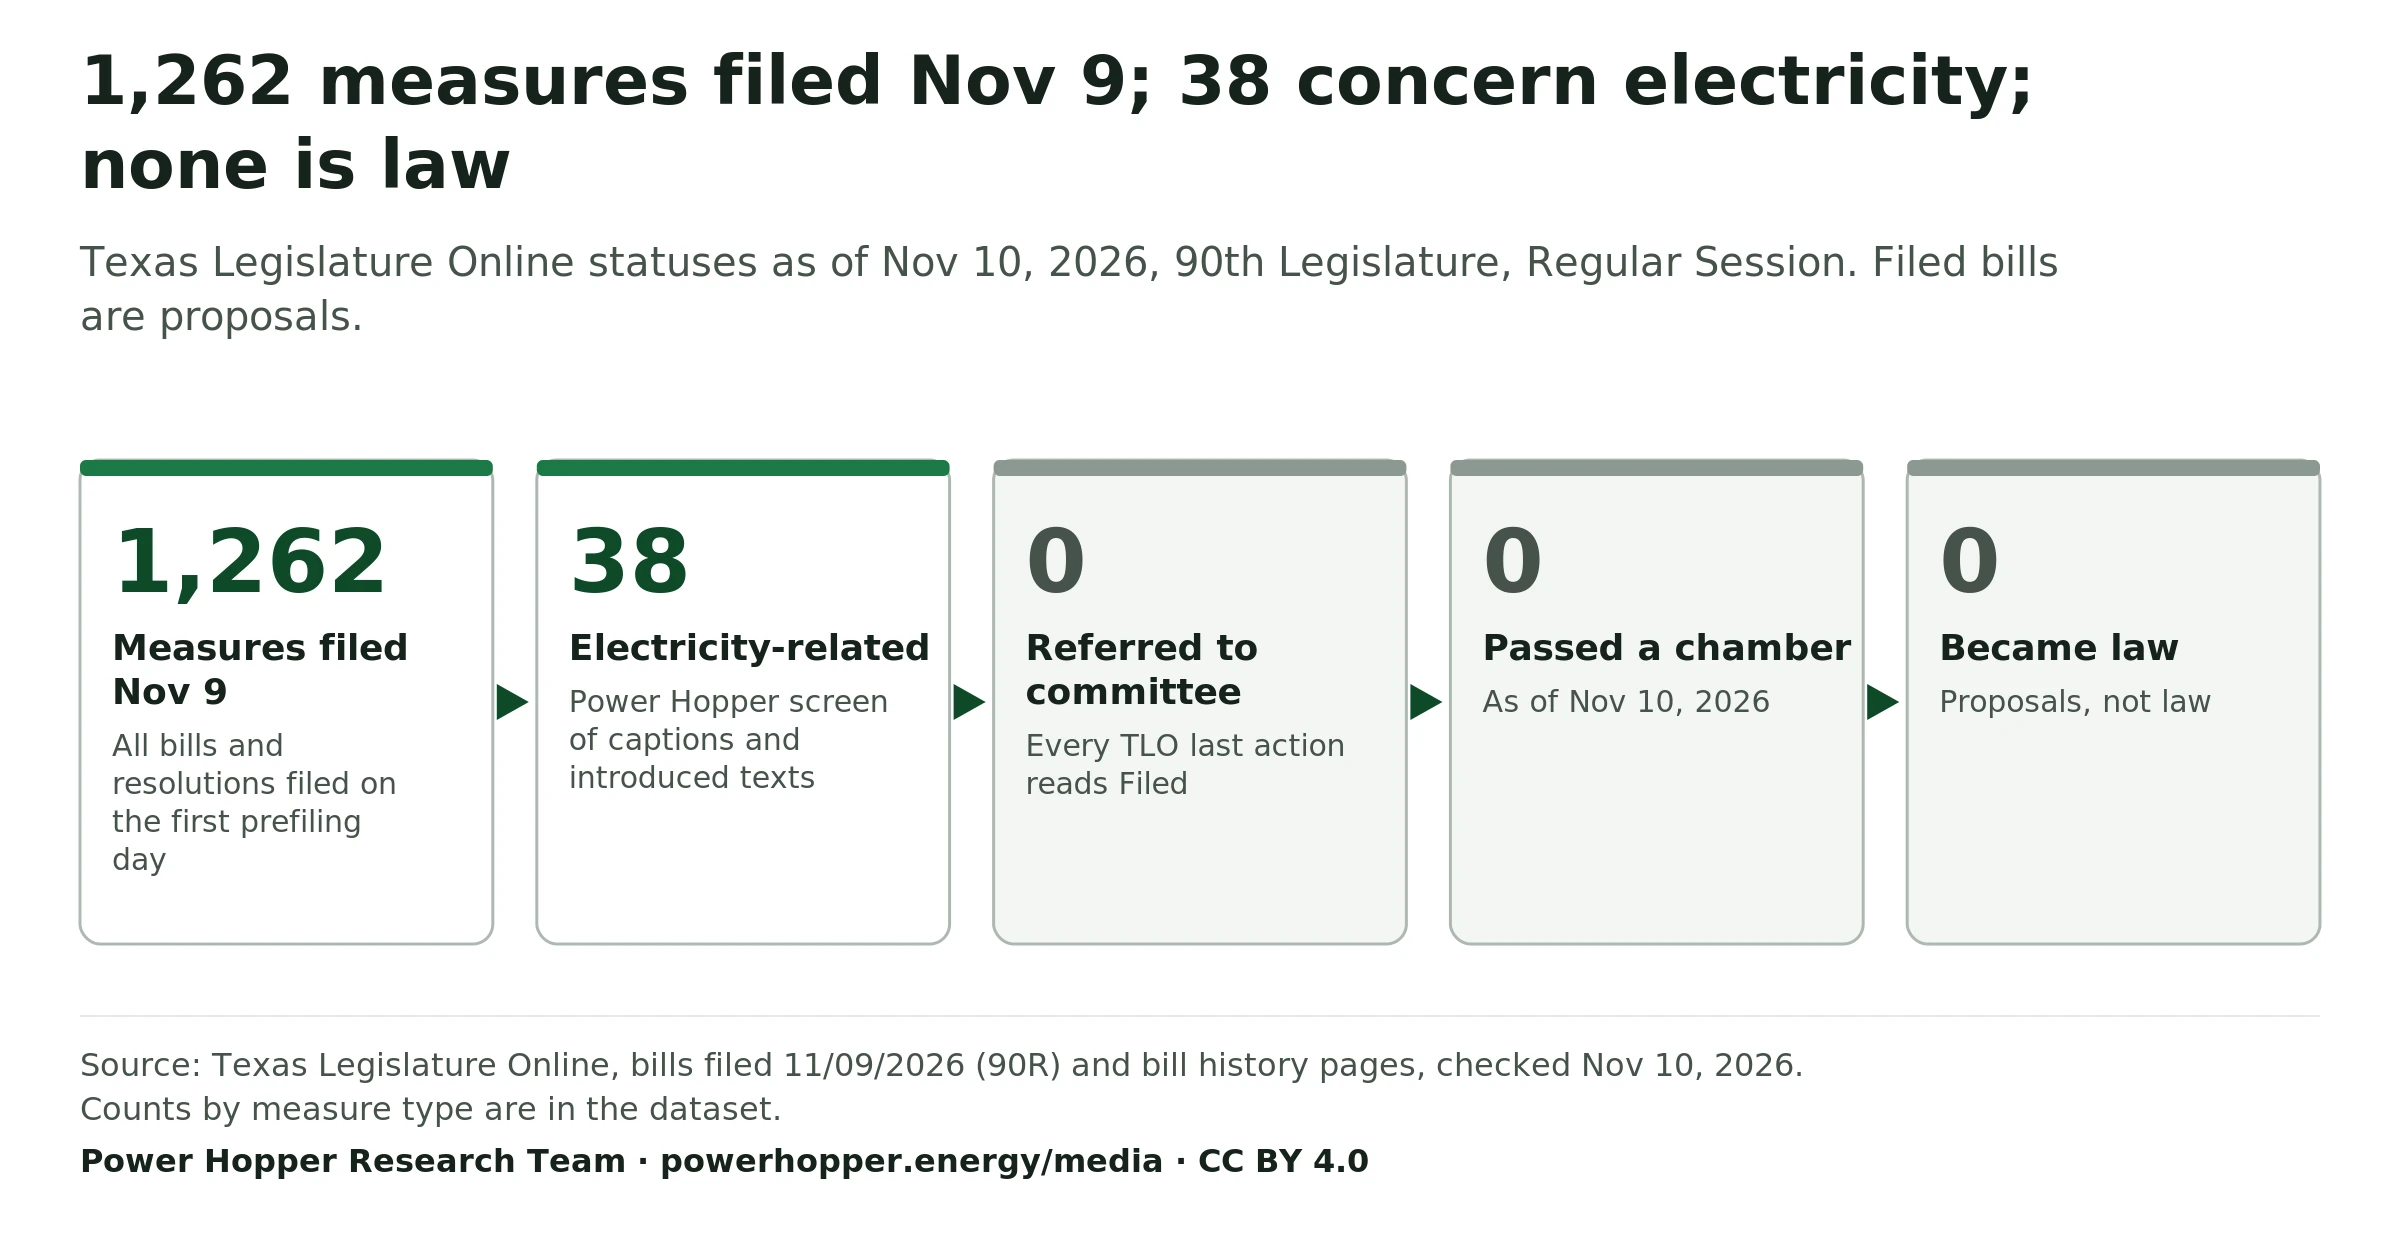
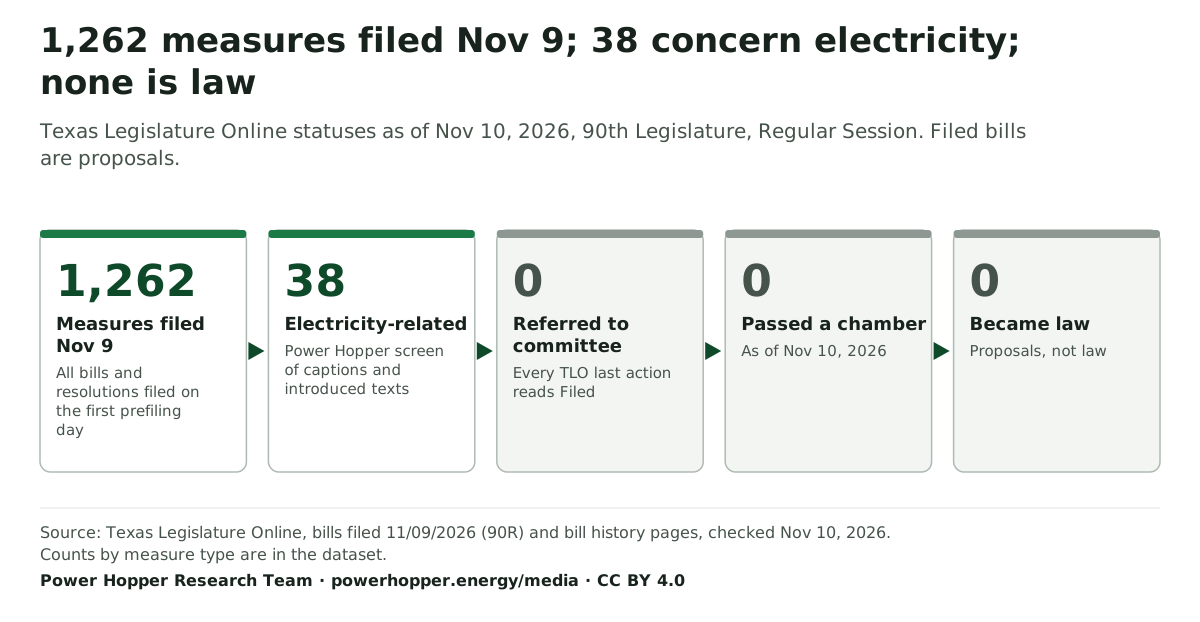
1,262 measures filed Nov 9; 38 concern electricity; none is law
Texas Legislature Online statuses as of Nov 10, 2026, 90th Legislature, Regular Session. Filed bills are proposals.
1,262Measures filed Nov 9All bills and resolutions filed on the first prefiling day
38Electricity-relatedPower Hopper screen of captions and introduced texts
0Referred to committeeEvery TLO last action reads Filed
0Passed a chamberAs of Nov 10, 2026
0Became lawProposals, not law
Source: Texas Legislature Online, bills filed 11/09/2026 (90R) and bill history pages, checked Nov 10, 2026. Counts by measure type are in the dataset.
Power Hopper Research Team. "From filed to law: status of the Nov 9, 2026 electricity bills." Chart. Texas Electricity Bills Filed Nov 9, 2026 (Pending Proposals) dataset. Power Hopper Media Data Room, published November 10, 2026. https://powerhopper.energy/media/charts#chart-texas-legislature-electricity-bills-filed-to-law-flow-2026-11-10. Accessed [date accessed].
Data table
From filed to law: status of the Nov 9, 2026 electricity bills
Step
Count
Note
Measures filed Nov 9
1,262
All bills and resolutions filed on the first prefiling day
Electricity-related
38
Power Hopper screen of captions and introduced texts