
Charts
11 charts built from the published datasets. Each states its takeaway, labels every value, and gives its source, a data table, a ready-to-copy citation and PNG, WebP and SVG downloads.
Usage sensitivity and bill credits
Plan Structure · EFLs issued Oct 15, 2026 to Oct 28, 2026
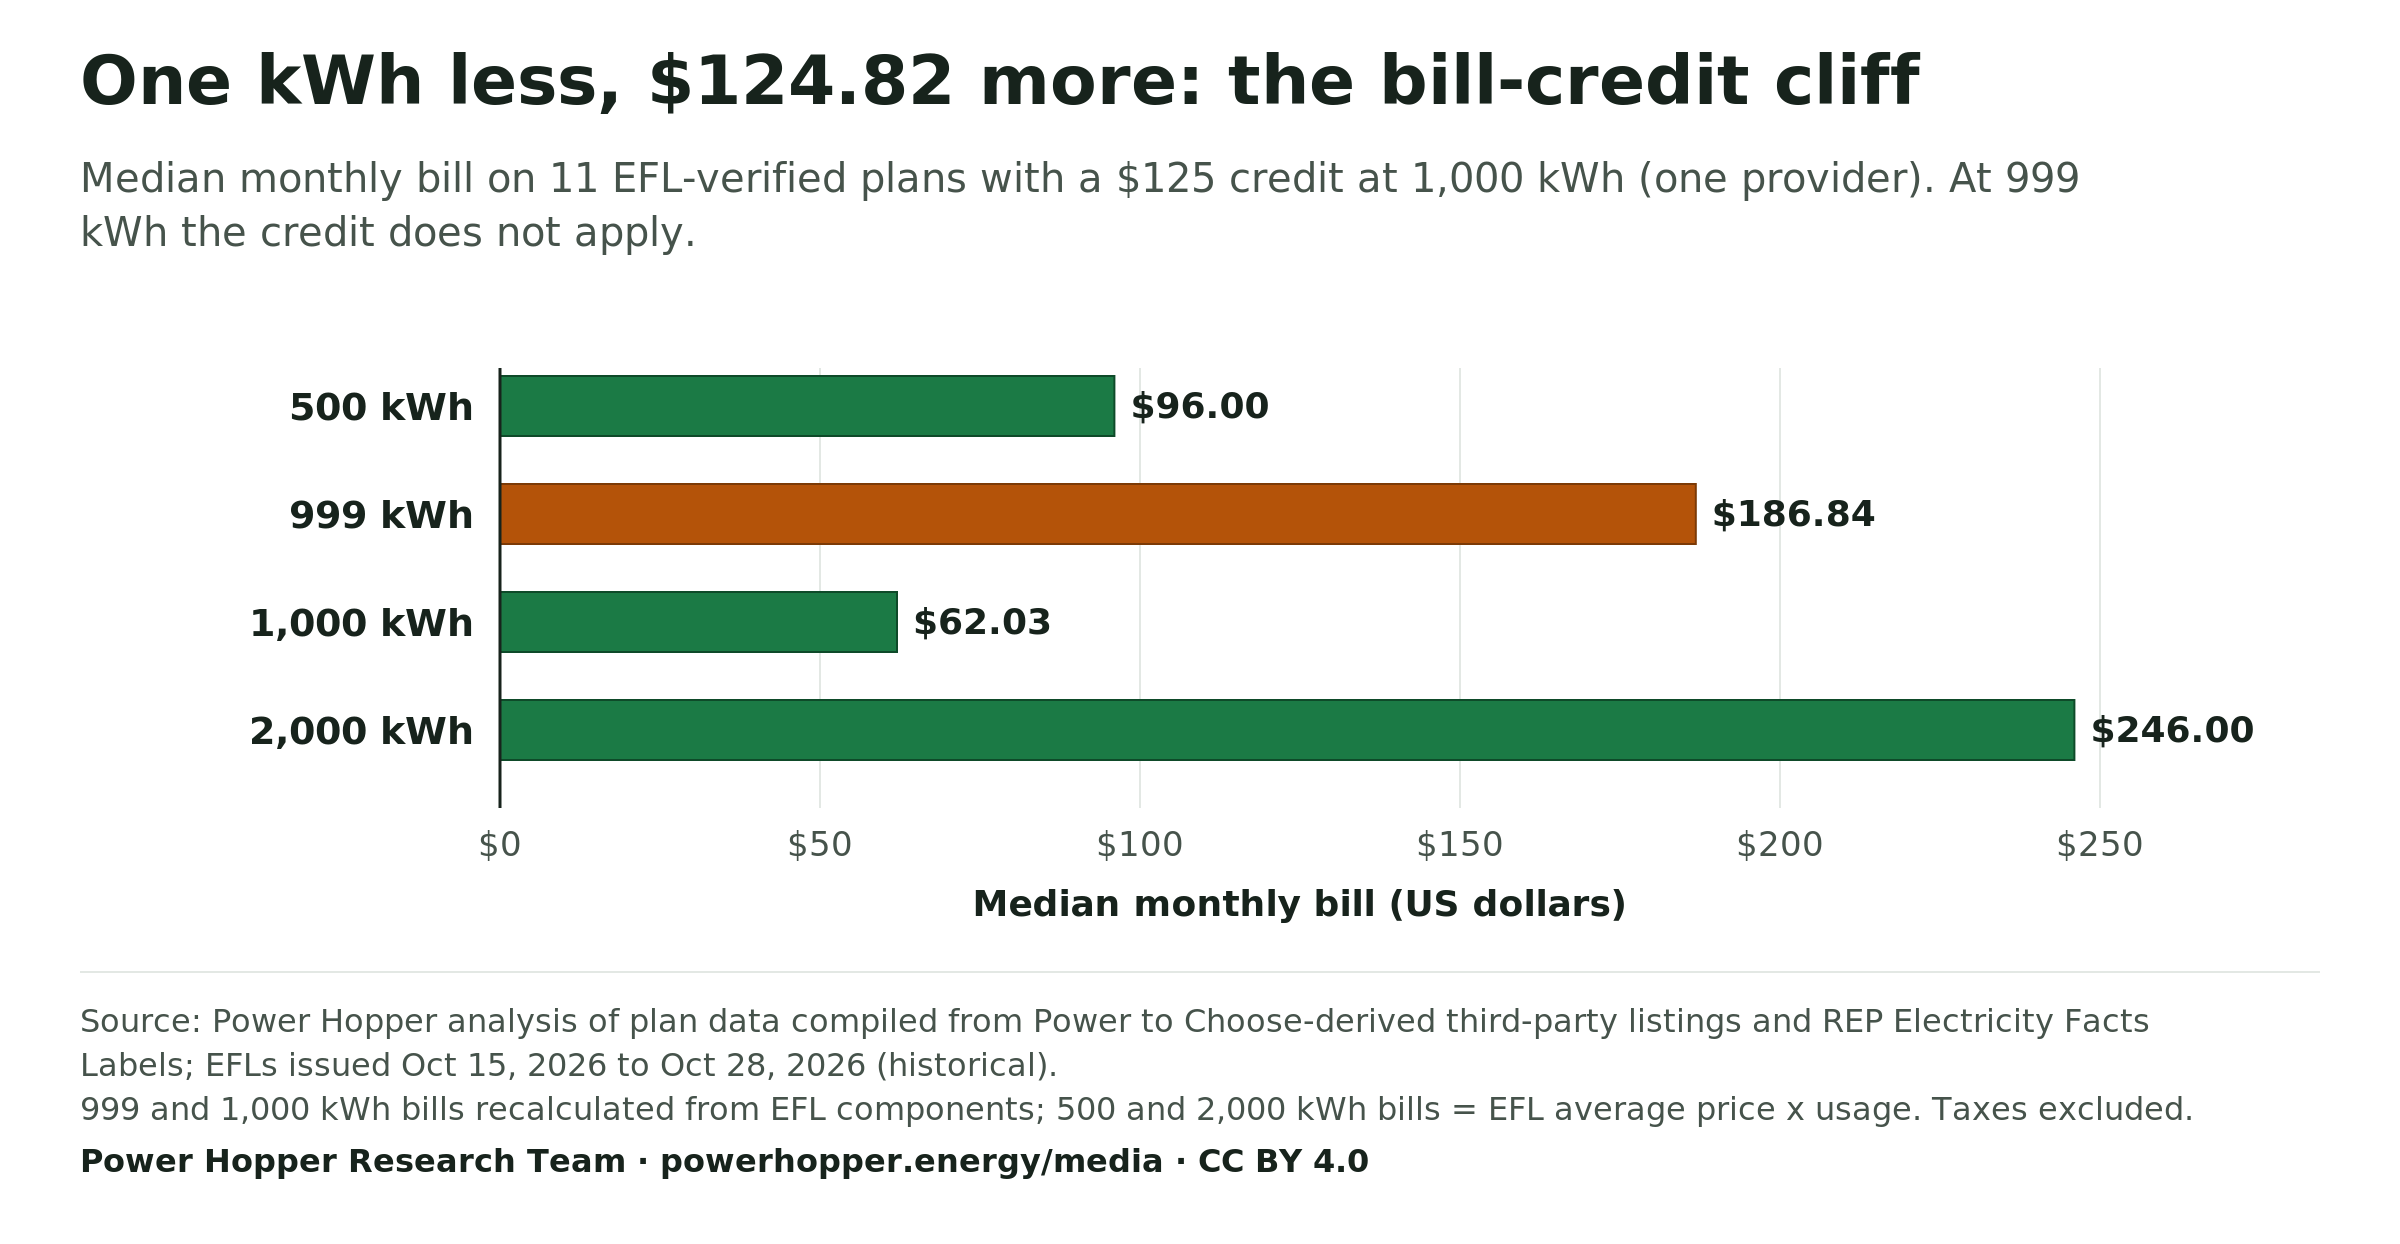
One kWh less, $124.82 more: the bill-credit cliff
Median monthly bill on 11 EFL-verified plans with a $125 credit at 1,000 kWh (one provider). At 999 kWh the credit does not apply.
Median monthly bill (US dollars)
Source: Power Hopper analysis of plan data compiled from Power to Choose-derived third-party listings and REP Electricity Facts Labels; EFLs issued Oct 15, 2026 to Oct 28, 2026 (historical). 999 and 1,000 kWh bills recalculated from EFL components; 500 and 2,000 kWh bills = EFL average price x usage. Taxes excluded.
Download PNG of The bill-credit cliff: median monthly bill at 500, 999, 1,000 and 2,000 kWh WebP of The bill-credit cliff: median monthly bill at 500, 999, 1,000 and 2,000 kWh SVG of The bill-credit cliff: median monthly bill at 500, 999, 1,000 and 2,000 kWh
Cite this chart
Power Hopper Research Team. "The bill-credit cliff: median monthly bill at 500, 999, 1,000 and 2,000 kWh." Chart. The 1,000 kWh Bill-Credit Threshold: What One Kilowatt-Hour Costs dataset. Power Hopper Media Data Room, published November 10, 2026. https://powerhopper.energy/media/charts#chart-texas-bill-credit-cliff-median-bill-500-999-1000-2000-kwh. Accessed [date accessed].
Data table
| Monthly usage | Median monthly bill |
|---|---|
| 500 kWh | $96.00 |
| 999 kWh | $186.84 |
| 1,000 kWh | $62.03 |
| 2,000 kWh | $246.00 |
Plan Structure · EFLs issued Oct 15, 2026 to Oct 28, 2026
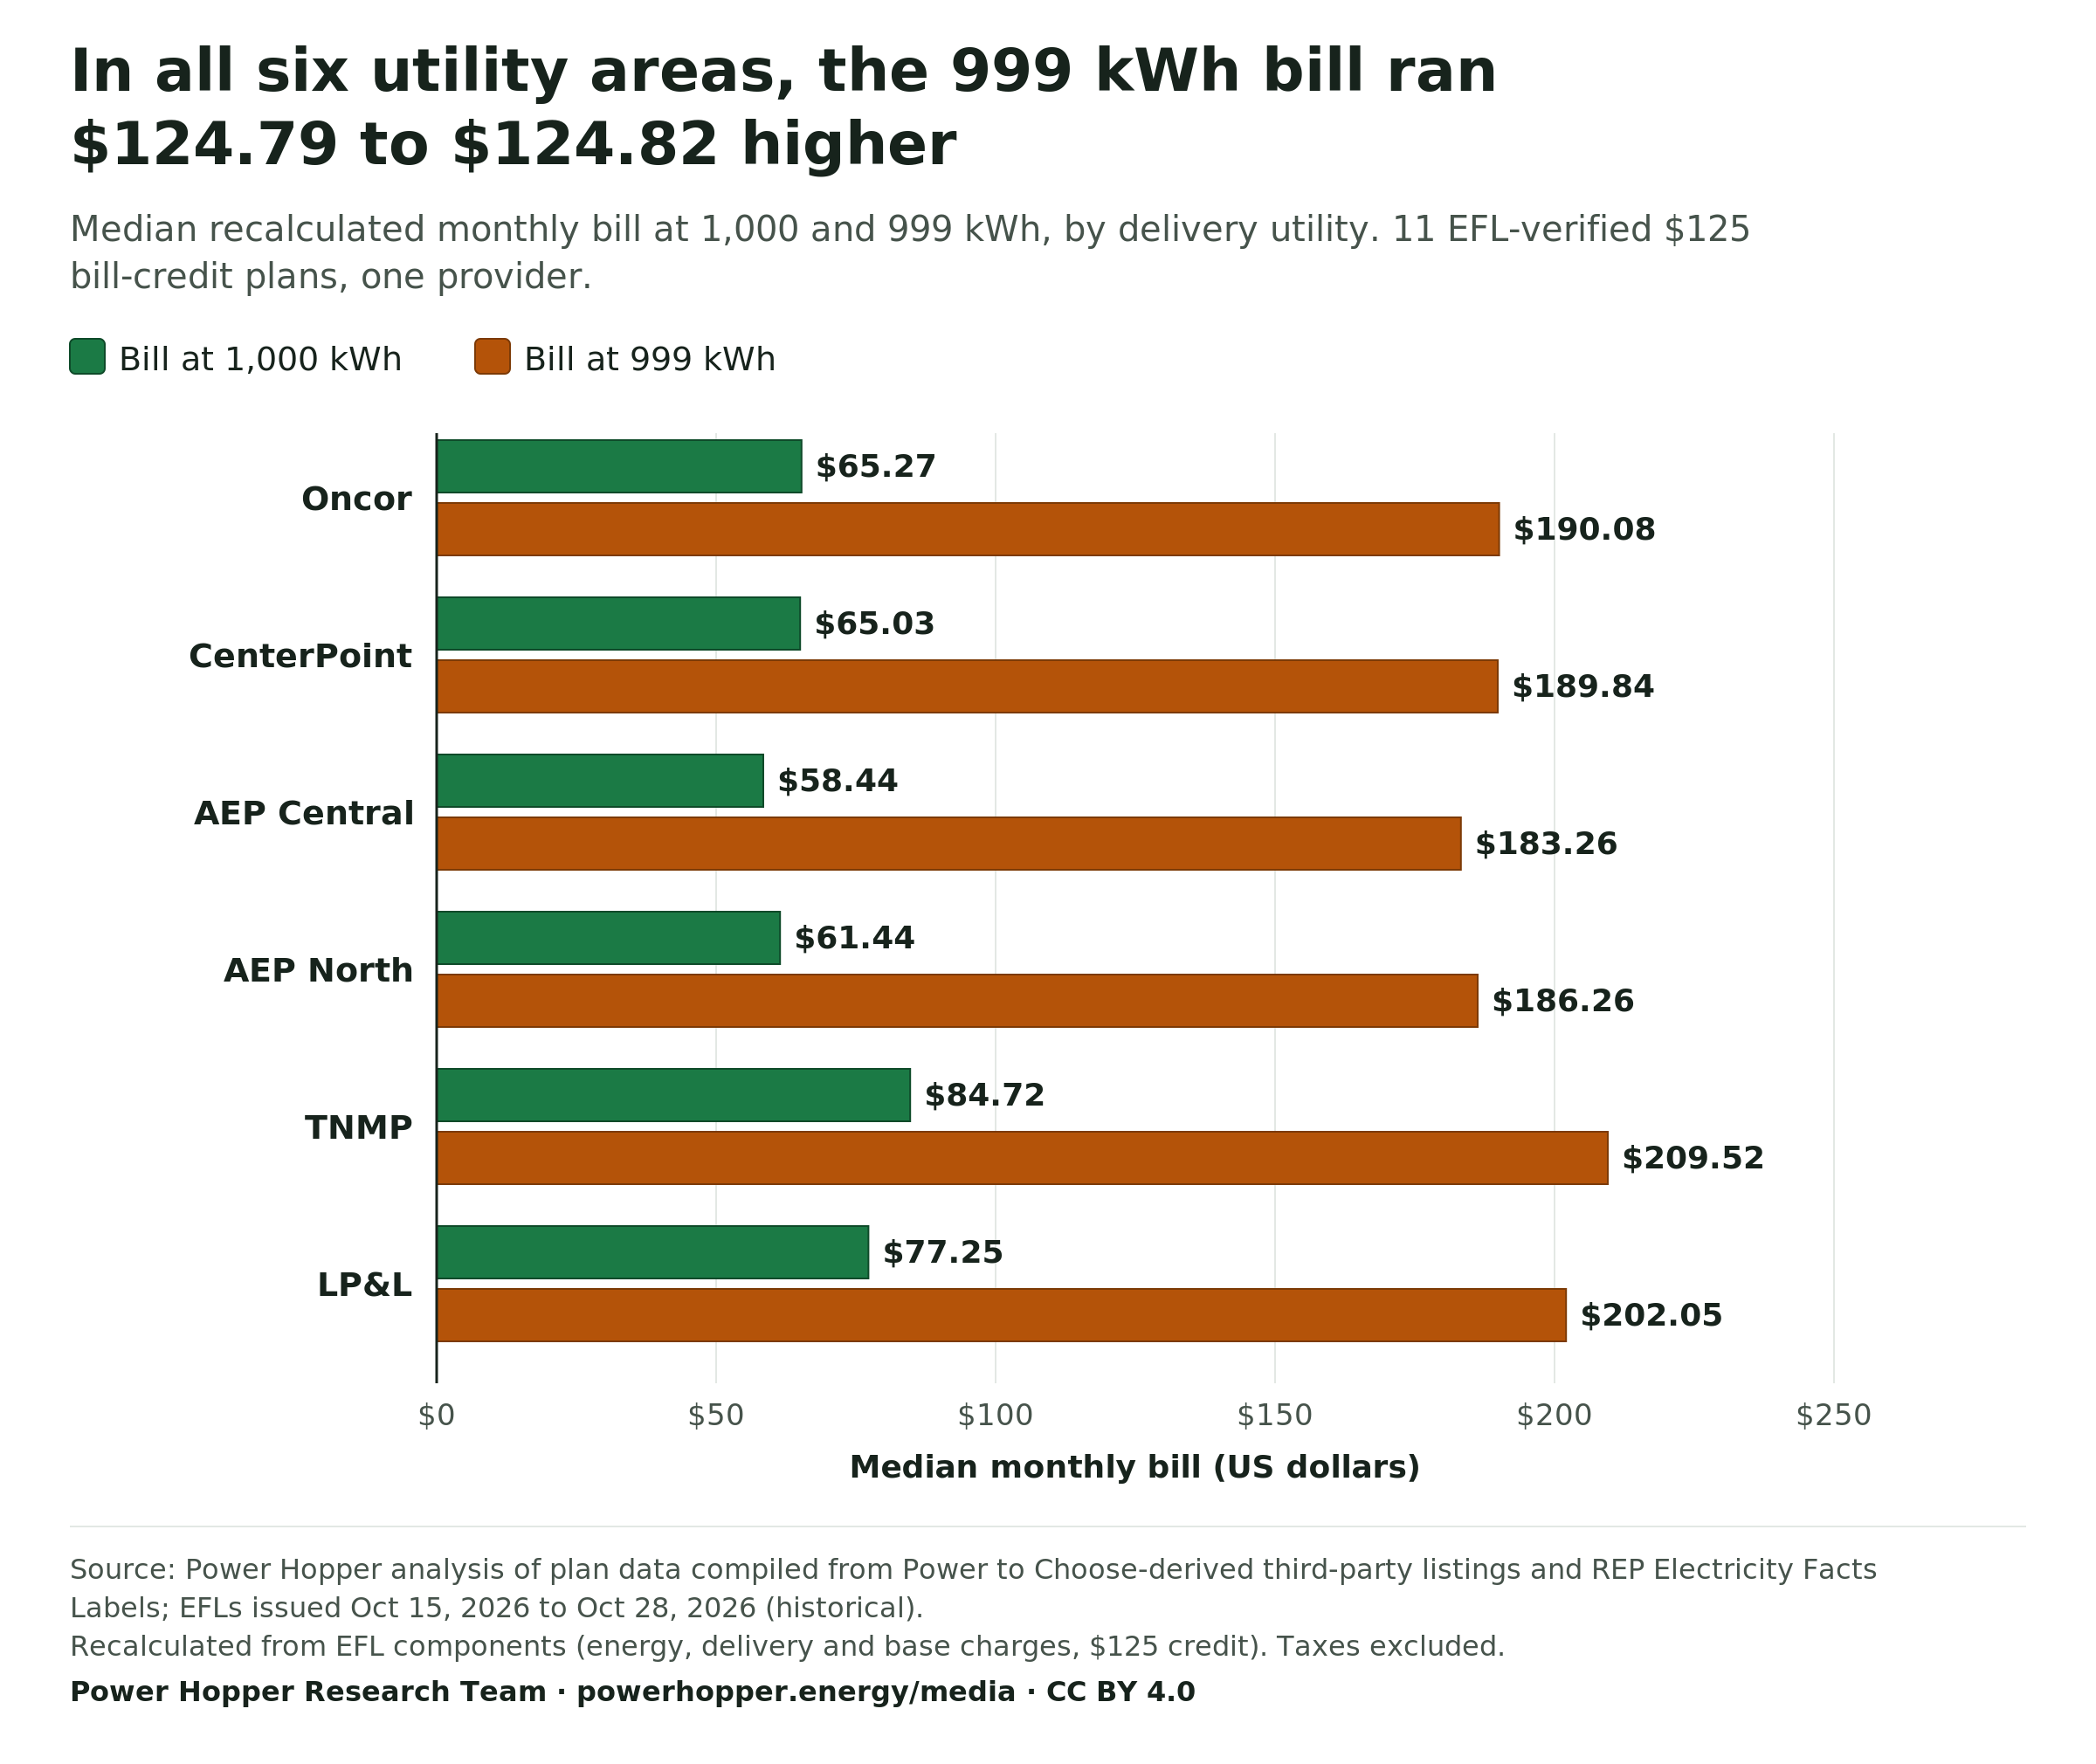
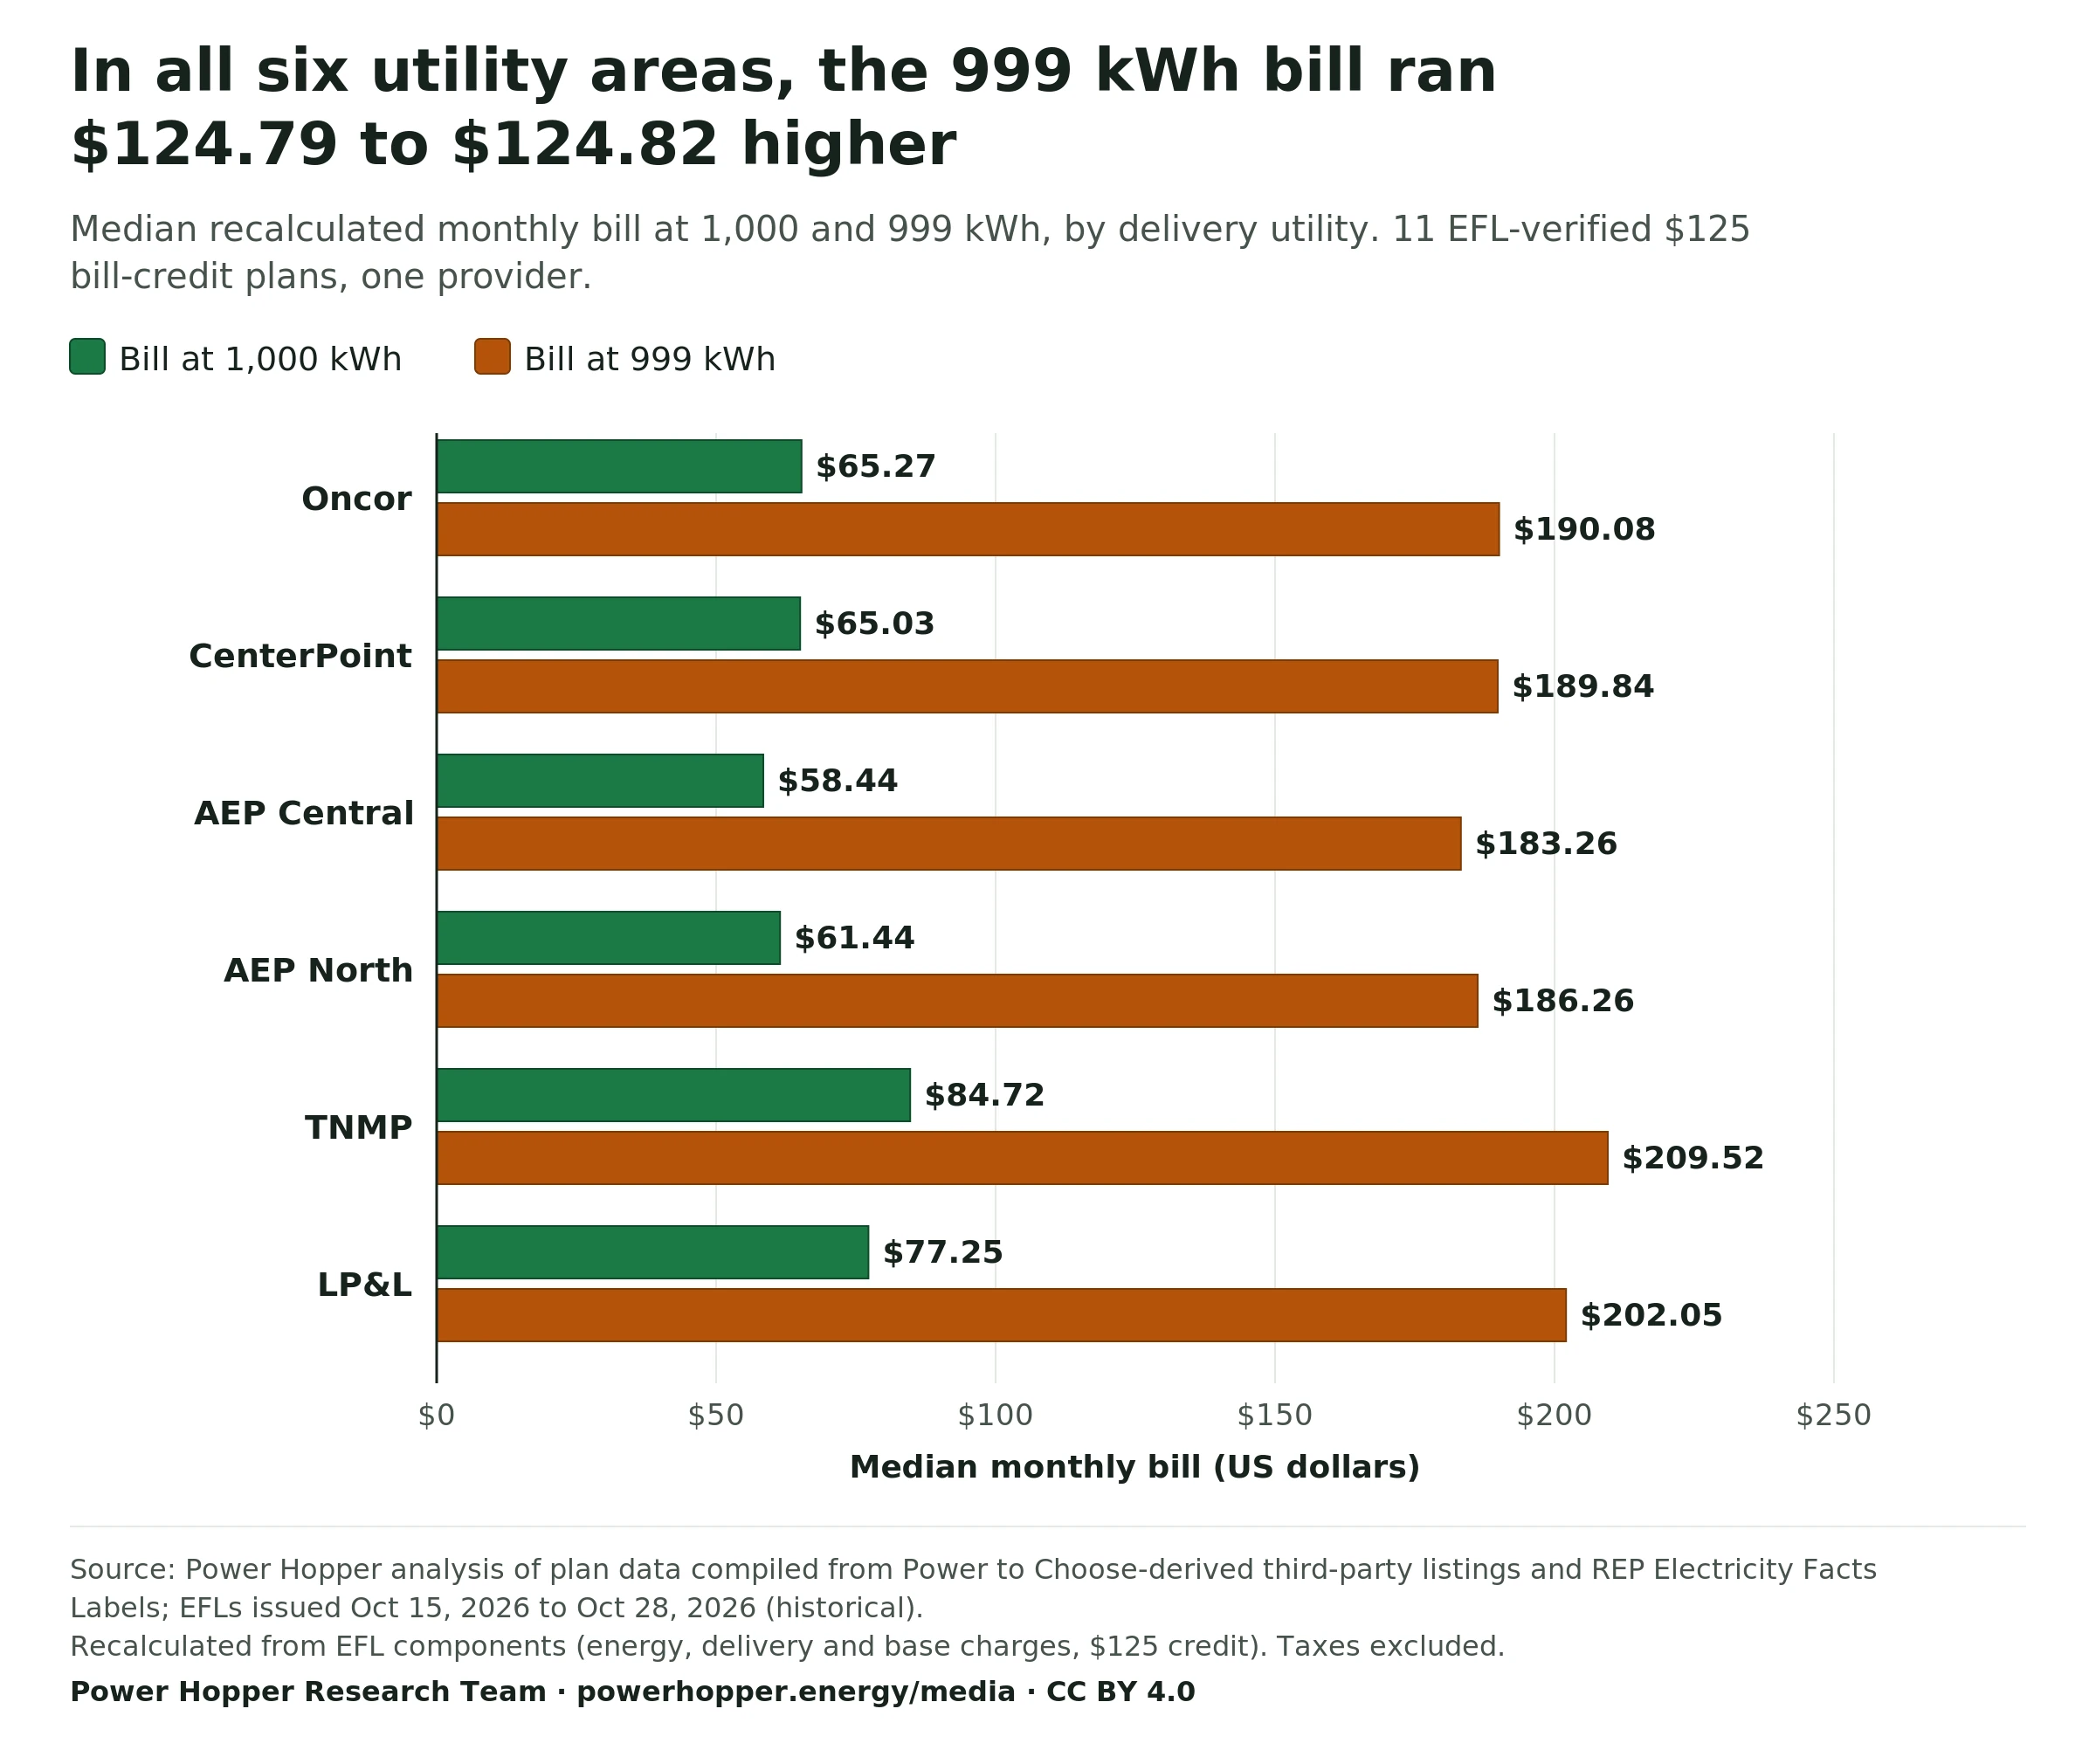
In all six utility areas, the 999 kWh bill ran $124.79 to $124.82 higher
Median recalculated monthly bill at 1,000 and 999 kWh, by delivery utility. 11 EFL-verified $125 bill-credit plans, one provider.
- Bill at 1,000 kWh
- Bill at 999 kWh
Median monthly bill (US dollars)
Source: Power Hopper analysis of plan data compiled from Power to Choose-derived third-party listings and REP Electricity Facts Labels; EFLs issued Oct 15, 2026 to Oct 28, 2026 (historical). Recalculated from EFL components (energy, delivery and base charges, $125 credit). Taxes excluded.
Download PNG of Bills at 1,000 vs 999 kWh on EFL-verified $125 bill-credit plans, by utility WebP of Bills at 1,000 vs 999 kWh on EFL-verified $125 bill-credit plans, by utility SVG of Bills at 1,000 vs 999 kWh on EFL-verified $125 bill-credit plans, by utility
Cite this chart
Power Hopper Research Team. "Bills at 1,000 vs 999 kWh on EFL-verified $125 bill-credit plans, by utility." Chart. The 1,000 kWh Bill-Credit Threshold: What One Kilowatt-Hour Costs dataset. Power Hopper Media Data Room, published November 10, 2026. https://powerhopper.energy/media/charts#chart-texas-bill-credit-plans-bill-at-999-vs-1000-kwh. Accessed [date accessed].
Data table
| Delivery utility | Bill at 1,000 kWh | Bill at 999 kWh |
|---|---|---|
| Oncor | $65.27 | $190.08 |
| CenterPoint | $65.03 | $189.84 |
| AEP Central | $58.44 | $183.26 |
| AEP North | $61.44 | $186.26 |
| TNMP | $84.72 | $209.52 |
| LP&L | $77.25 | $202.05 |
Electricity Rates · Nov 10, 2026 snapshot
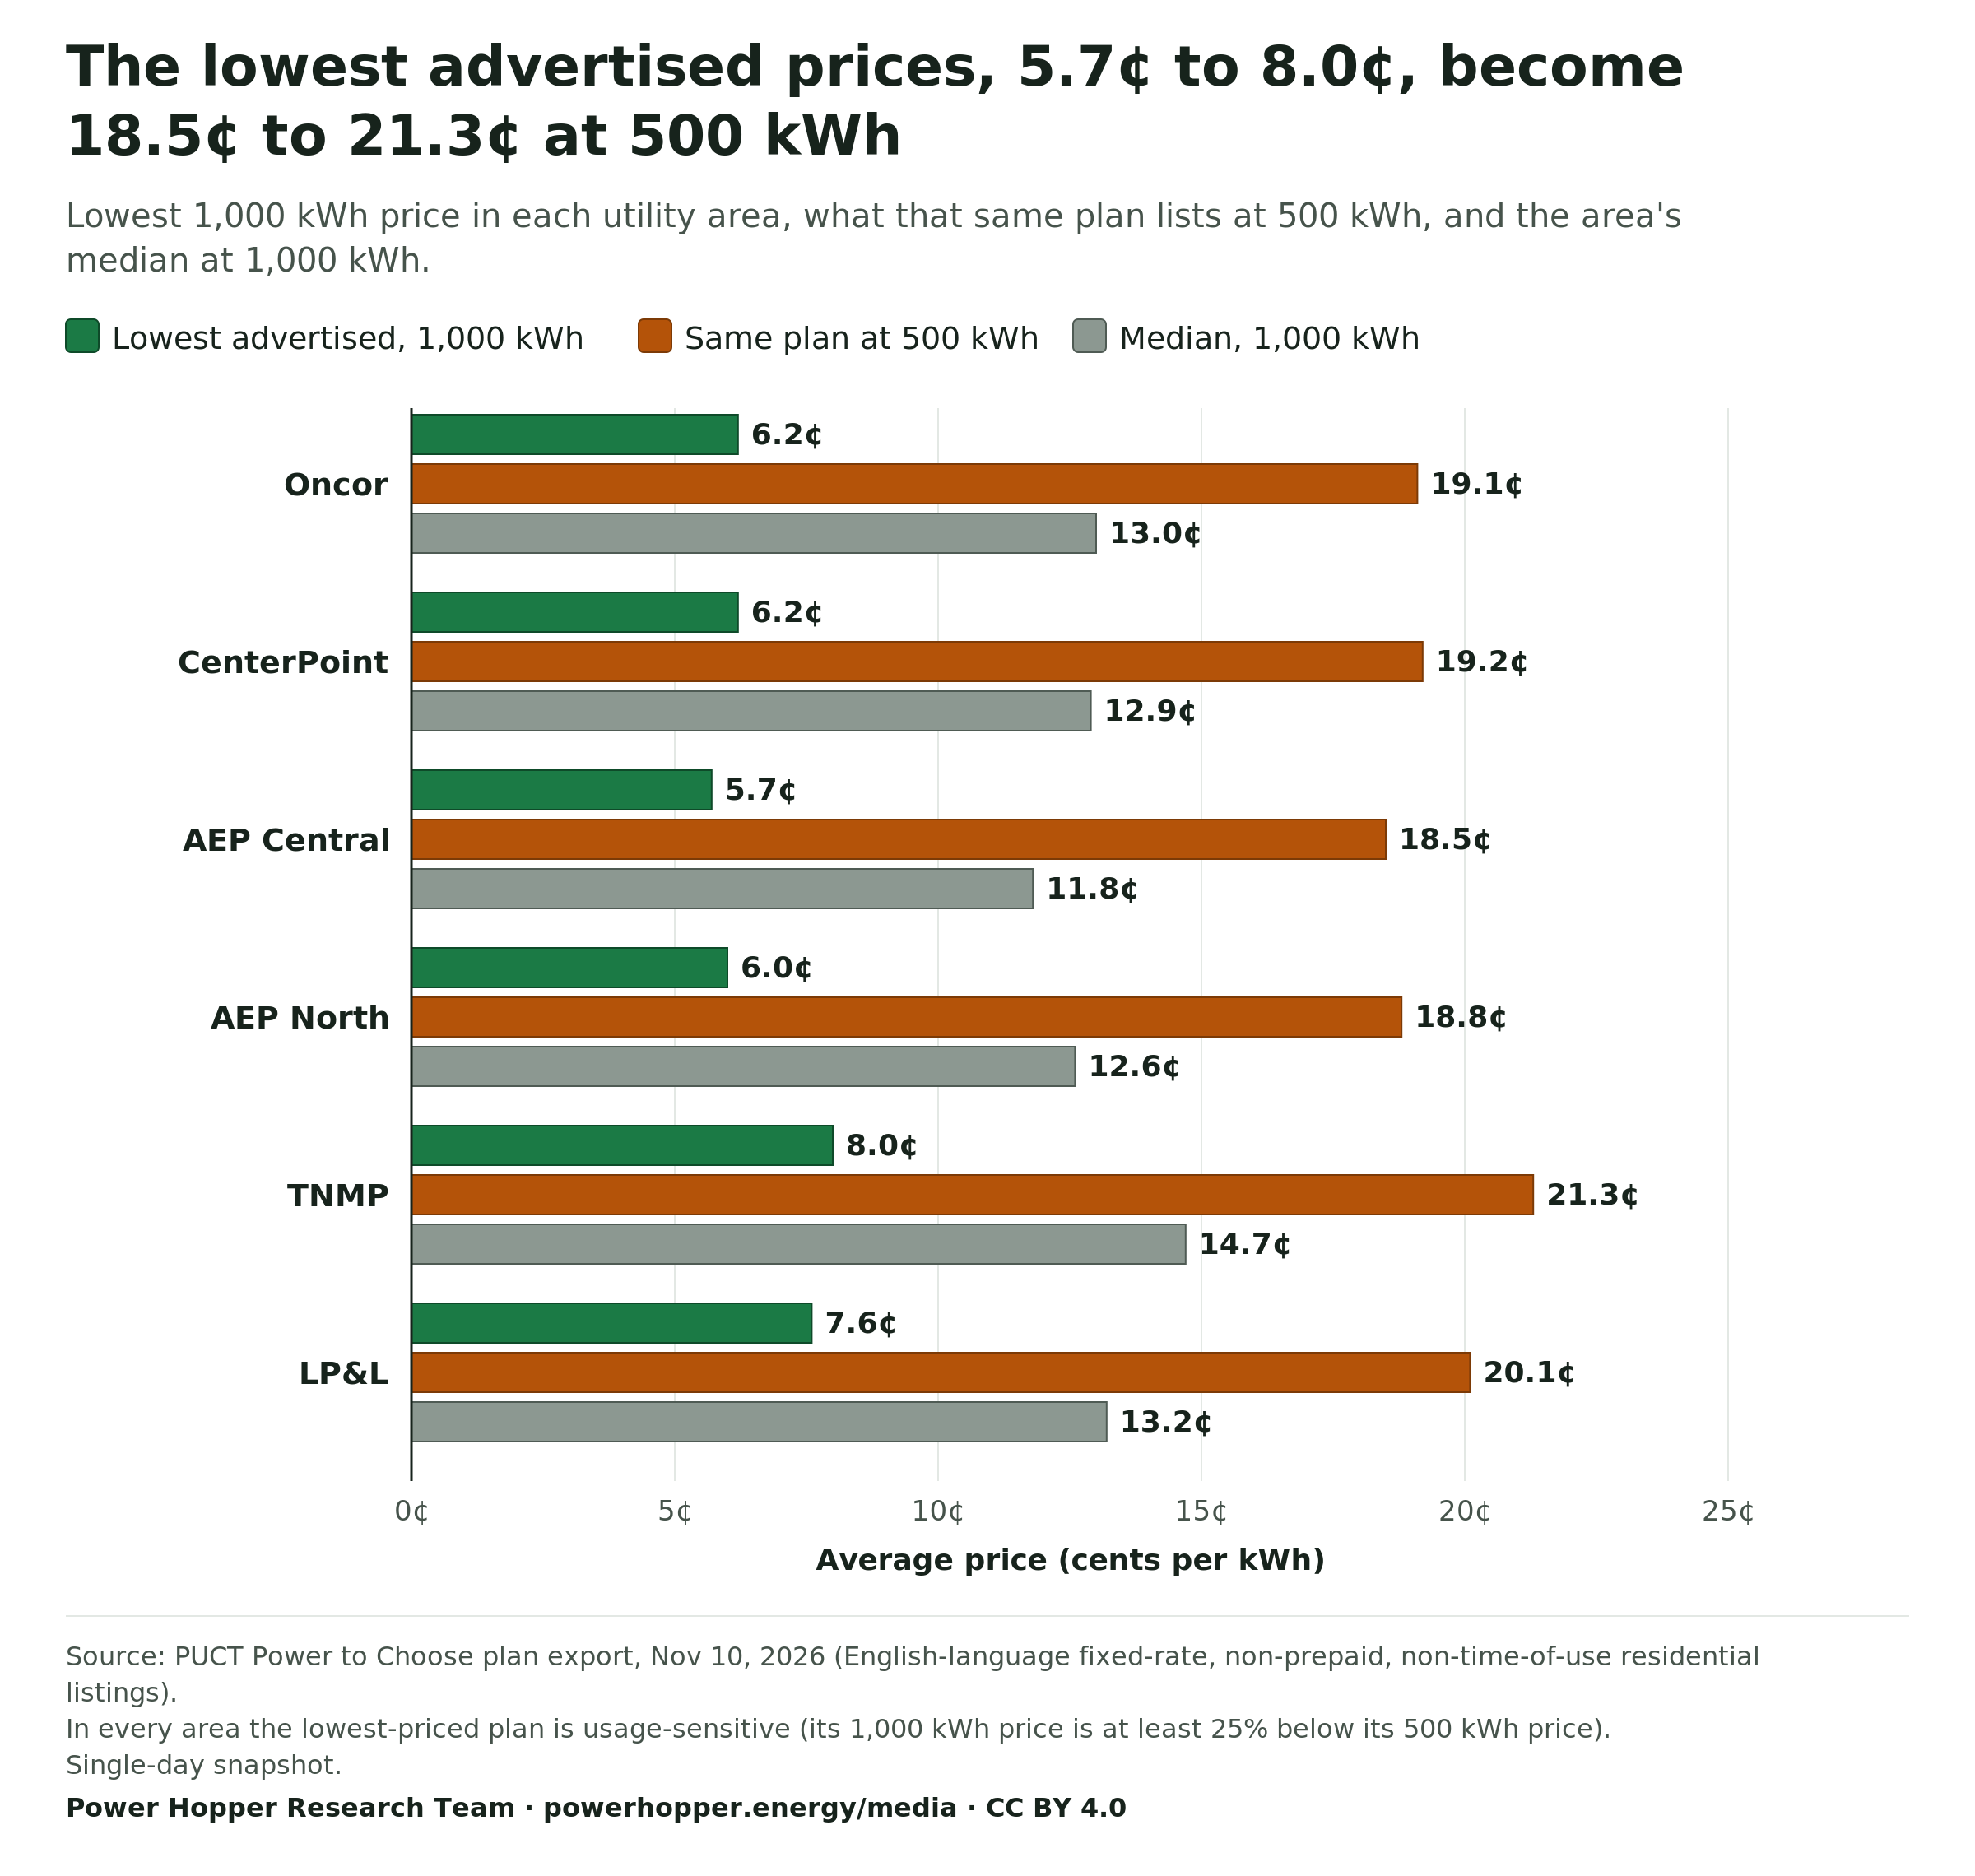
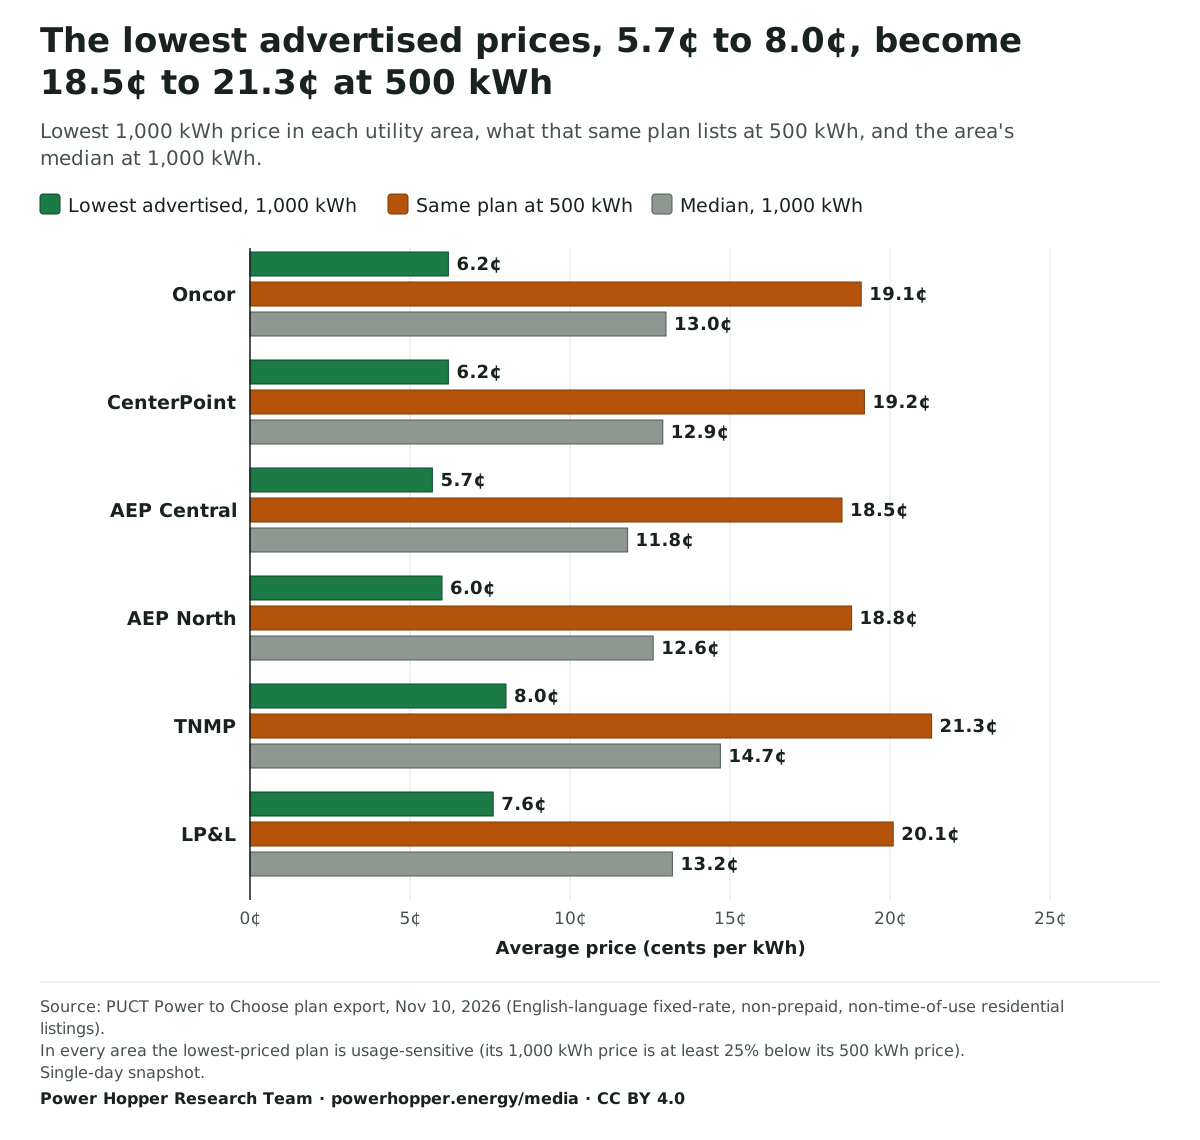
The lowest advertised prices, 5.7¢ to 8.0¢, become 18.5¢ to 21.3¢ at 500 kWh
Lowest 1,000 kWh price in each utility area, what that same plan lists at 500 kWh, and the area's median at 1,000 kWh.
- Lowest advertised, 1,000 kWh
- Same plan at 500 kWh
- Median, 1,000 kWh
Average price (cents per kWh)
Source: PUCT Power to Choose plan export, Nov 10, 2026 (English-language fixed-rate, non-prepaid, non-time-of-use residential listings). In every area the lowest-priced plan is usage-sensitive (its 1,000 kWh price is at least 25% below its 500 kWh price). Single-day snapshot.
Download PNG of Lowest advertised 1,000 kWh price, the same plan at 500 kWh, and the median, Nov 10, 2026 WebP of Lowest advertised 1,000 kWh price, the same plan at 500 kWh, and the median, Nov 10, 2026 SVG of Lowest advertised 1,000 kWh price, the same plan at 500 kWh, and the median, Nov 10, 2026
Cite this chart
Power Hopper Research Team. "Lowest advertised 1,000 kWh price, the same plan at 500 kWh, and the median, Nov 10, 2026." Chart. Usage-Sensitive Plans and the Lowest-vs-Median Price Spread by Utility dataset. Power Hopper Media Data Room, published November 10, 2026. https://powerhopper.energy/media/charts#chart-texas-lowest-vs-median-plan-price-1000-kwh-2026-11-10. Accessed [date accessed].
Data table
| Delivery utility | Lowest advertised, 1,000 kWh | Same plan at 500 kWh | Median, 1,000 kWh |
|---|---|---|---|
| Oncor | 6.2¢ | 19.1¢ | 13.0¢ |
| CenterPoint | 6.2¢ | 19.2¢ | 12.9¢ |
| AEP Central | 5.7¢ | 18.5¢ | 11.8¢ |
| AEP North | 6.0¢ | 18.8¢ | 12.6¢ |
| TNMP | 8.0¢ | 21.3¢ | 14.7¢ |
| LP&L | 7.6¢ | 20.1¢ | 13.2¢ |
Plan Structure · Nov 10, 2026 snapshot
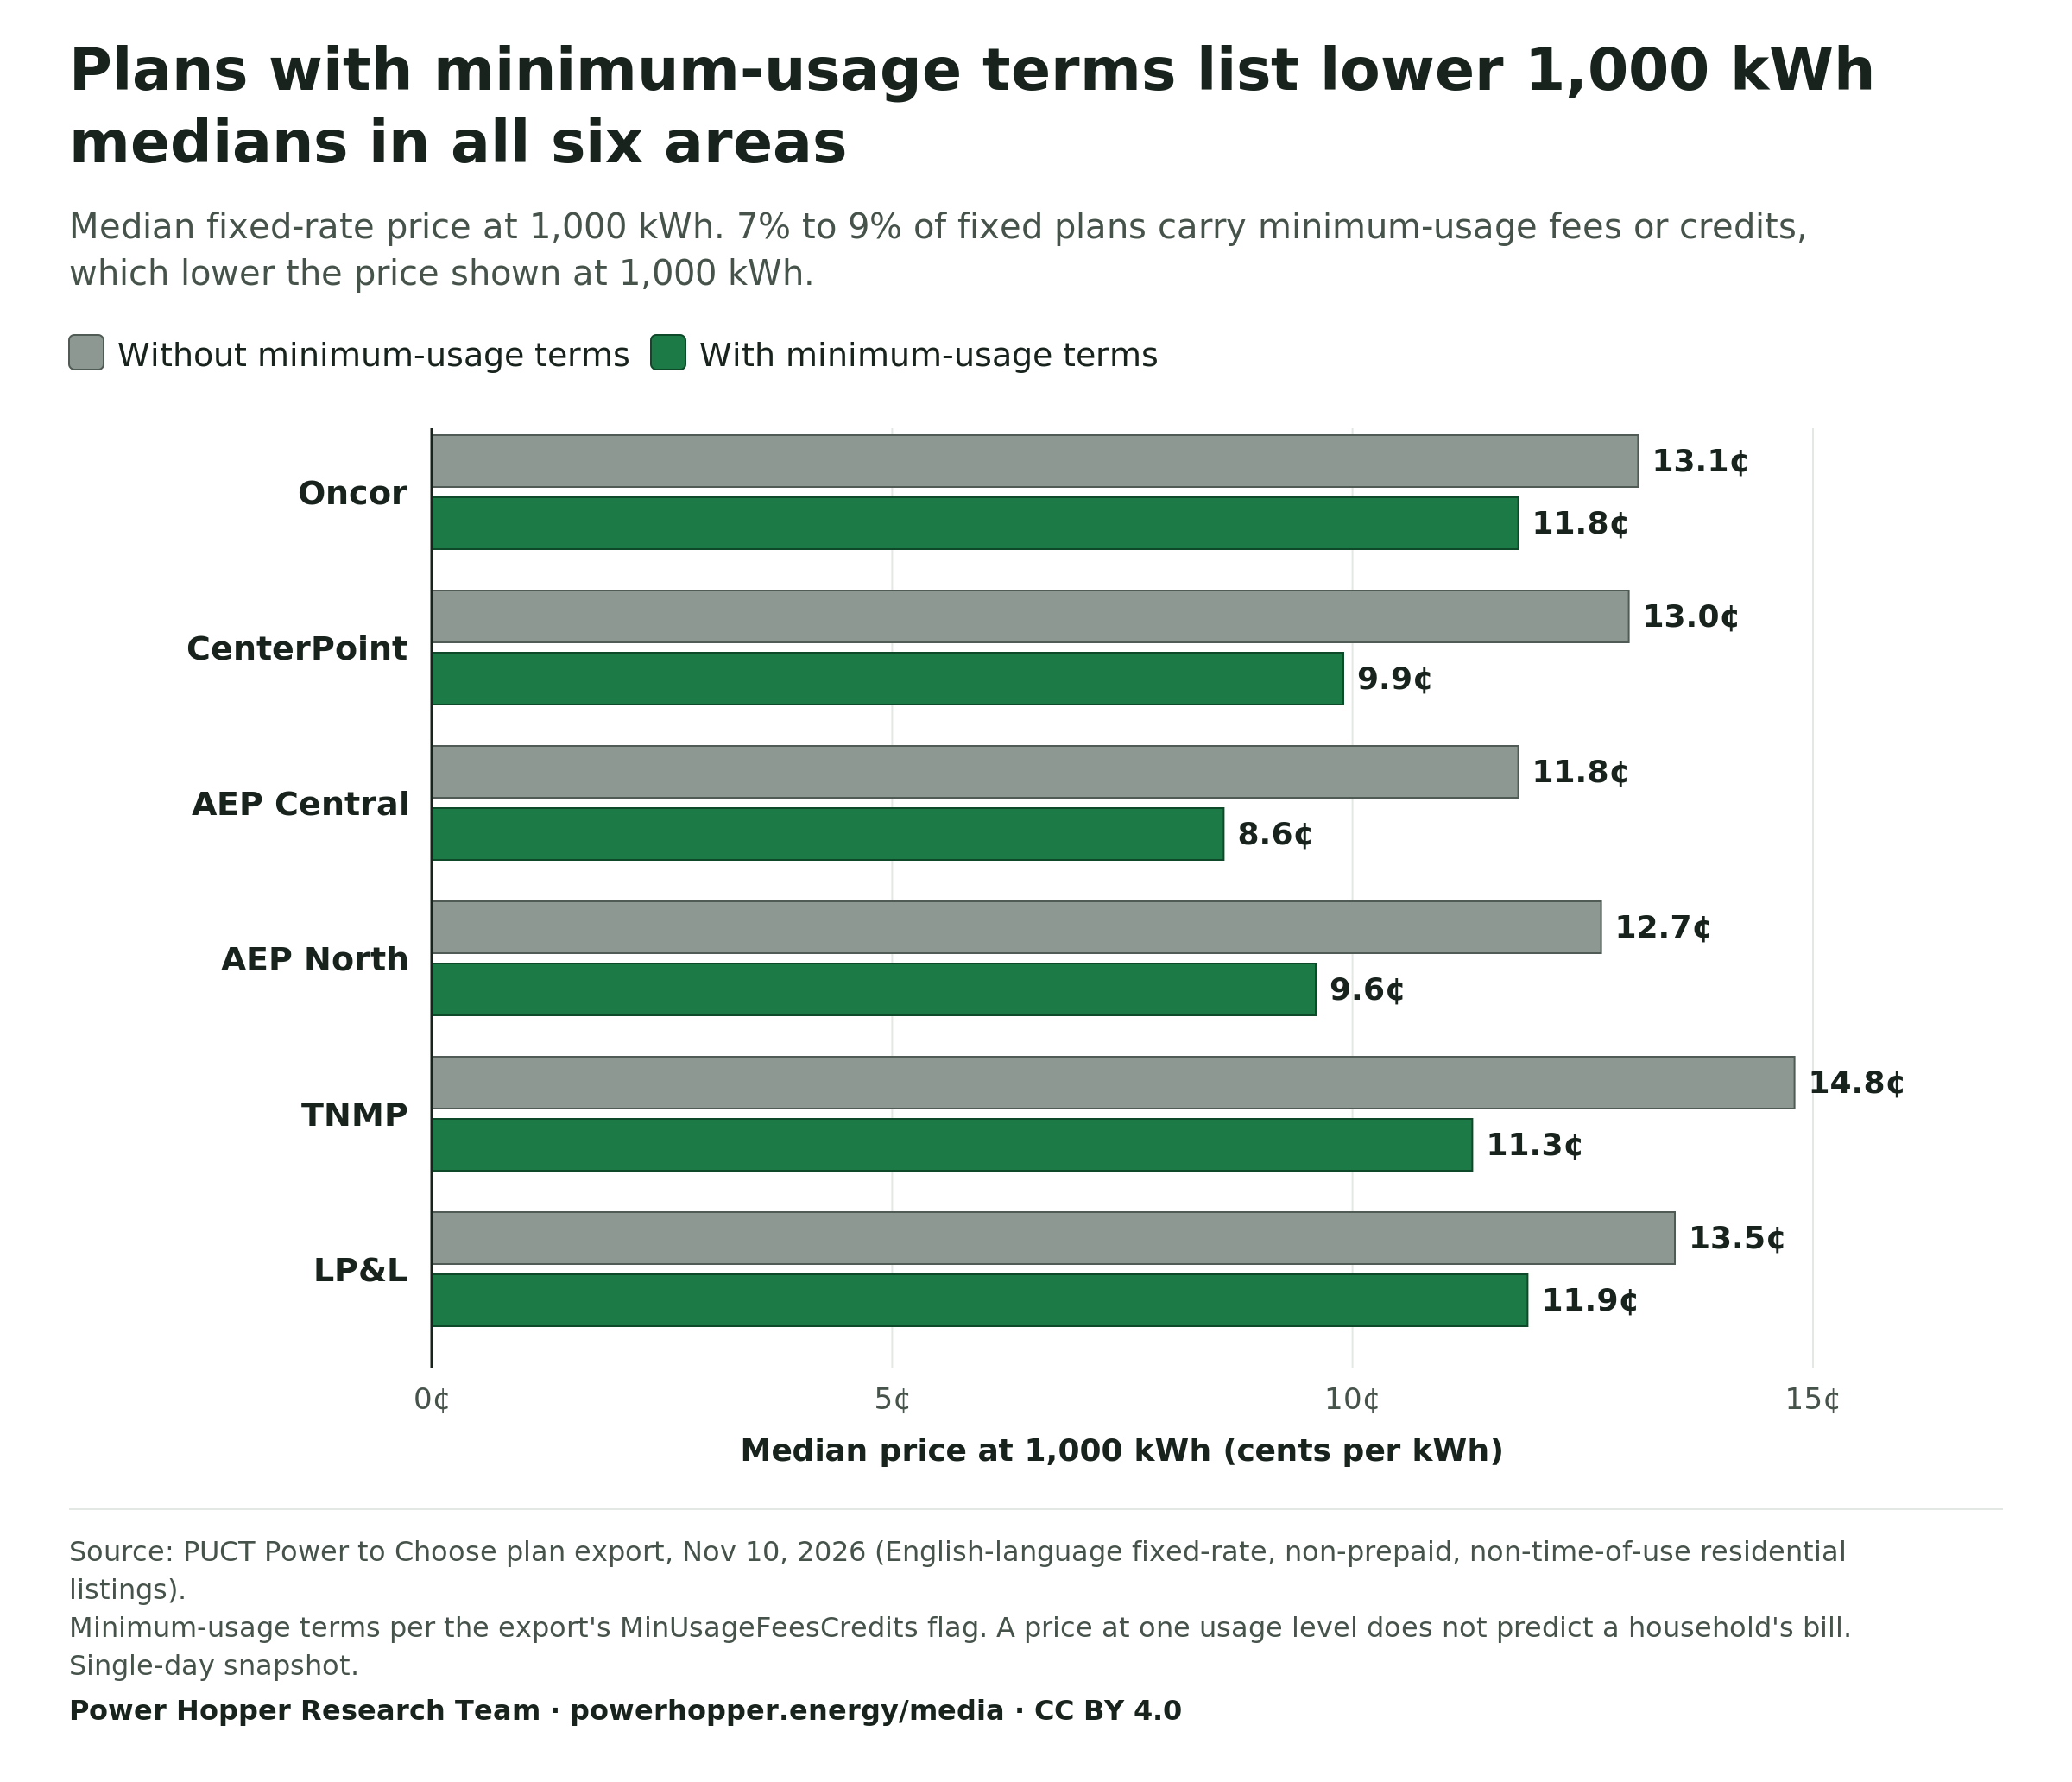
Plans with minimum-usage terms list lower 1,000 kWh medians in all six areas
Median fixed-rate price at 1,000 kWh. 7% to 9% of fixed plans carry minimum-usage fees or credits, which lower the price shown at 1,000 kWh.
- Without minimum-usage terms
- With minimum-usage terms
Median price at 1,000 kWh (cents per kWh)
Source: PUCT Power to Choose plan export, Nov 10, 2026 (English-language fixed-rate, non-prepaid, non-time-of-use residential listings). Minimum-usage terms per the export's MinUsageFeesCredits flag. A price at one usage level does not predict a household's bill. Single-day snapshot.
Download PNG of Fixed-plan medians at 1,000 kWh with and without minimum-usage terms, Nov 10, 2026 WebP of Fixed-plan medians at 1,000 kWh with and without minimum-usage terms, Nov 10, 2026 SVG of Fixed-plan medians at 1,000 kWh with and without minimum-usage terms, Nov 10, 2026
Cite this chart
Power Hopper Research Team. "Fixed-plan medians at 1,000 kWh with and without minimum-usage terms, Nov 10, 2026." Chart. Texas Electricity Plan Structure by Utility dataset. Power Hopper Media Data Room, published November 10, 2026. https://powerhopper.energy/media/charts#chart-texas-fixed-plan-medians-with-and-without-minimum-usage-terms-2026-11-10. Accessed [date accessed].
Data table
| Delivery utility | Without minimum-usage terms | With minimum-usage terms |
|---|---|---|
| Oncor | 13.1¢ | 11.8¢ |
| CenterPoint | 13.0¢ | 9.9¢ |
| AEP Central | 11.8¢ | 8.6¢ |
| AEP North | 12.7¢ | 9.6¢ |
| TNMP | 14.8¢ | 11.3¢ |
| LP&L | 13.5¢ | 11.9¢ |
Delivery charges and bills
Utility Delivery Charges · Nov 1, 2026 delivery report; Nov 10, 2026 plan export
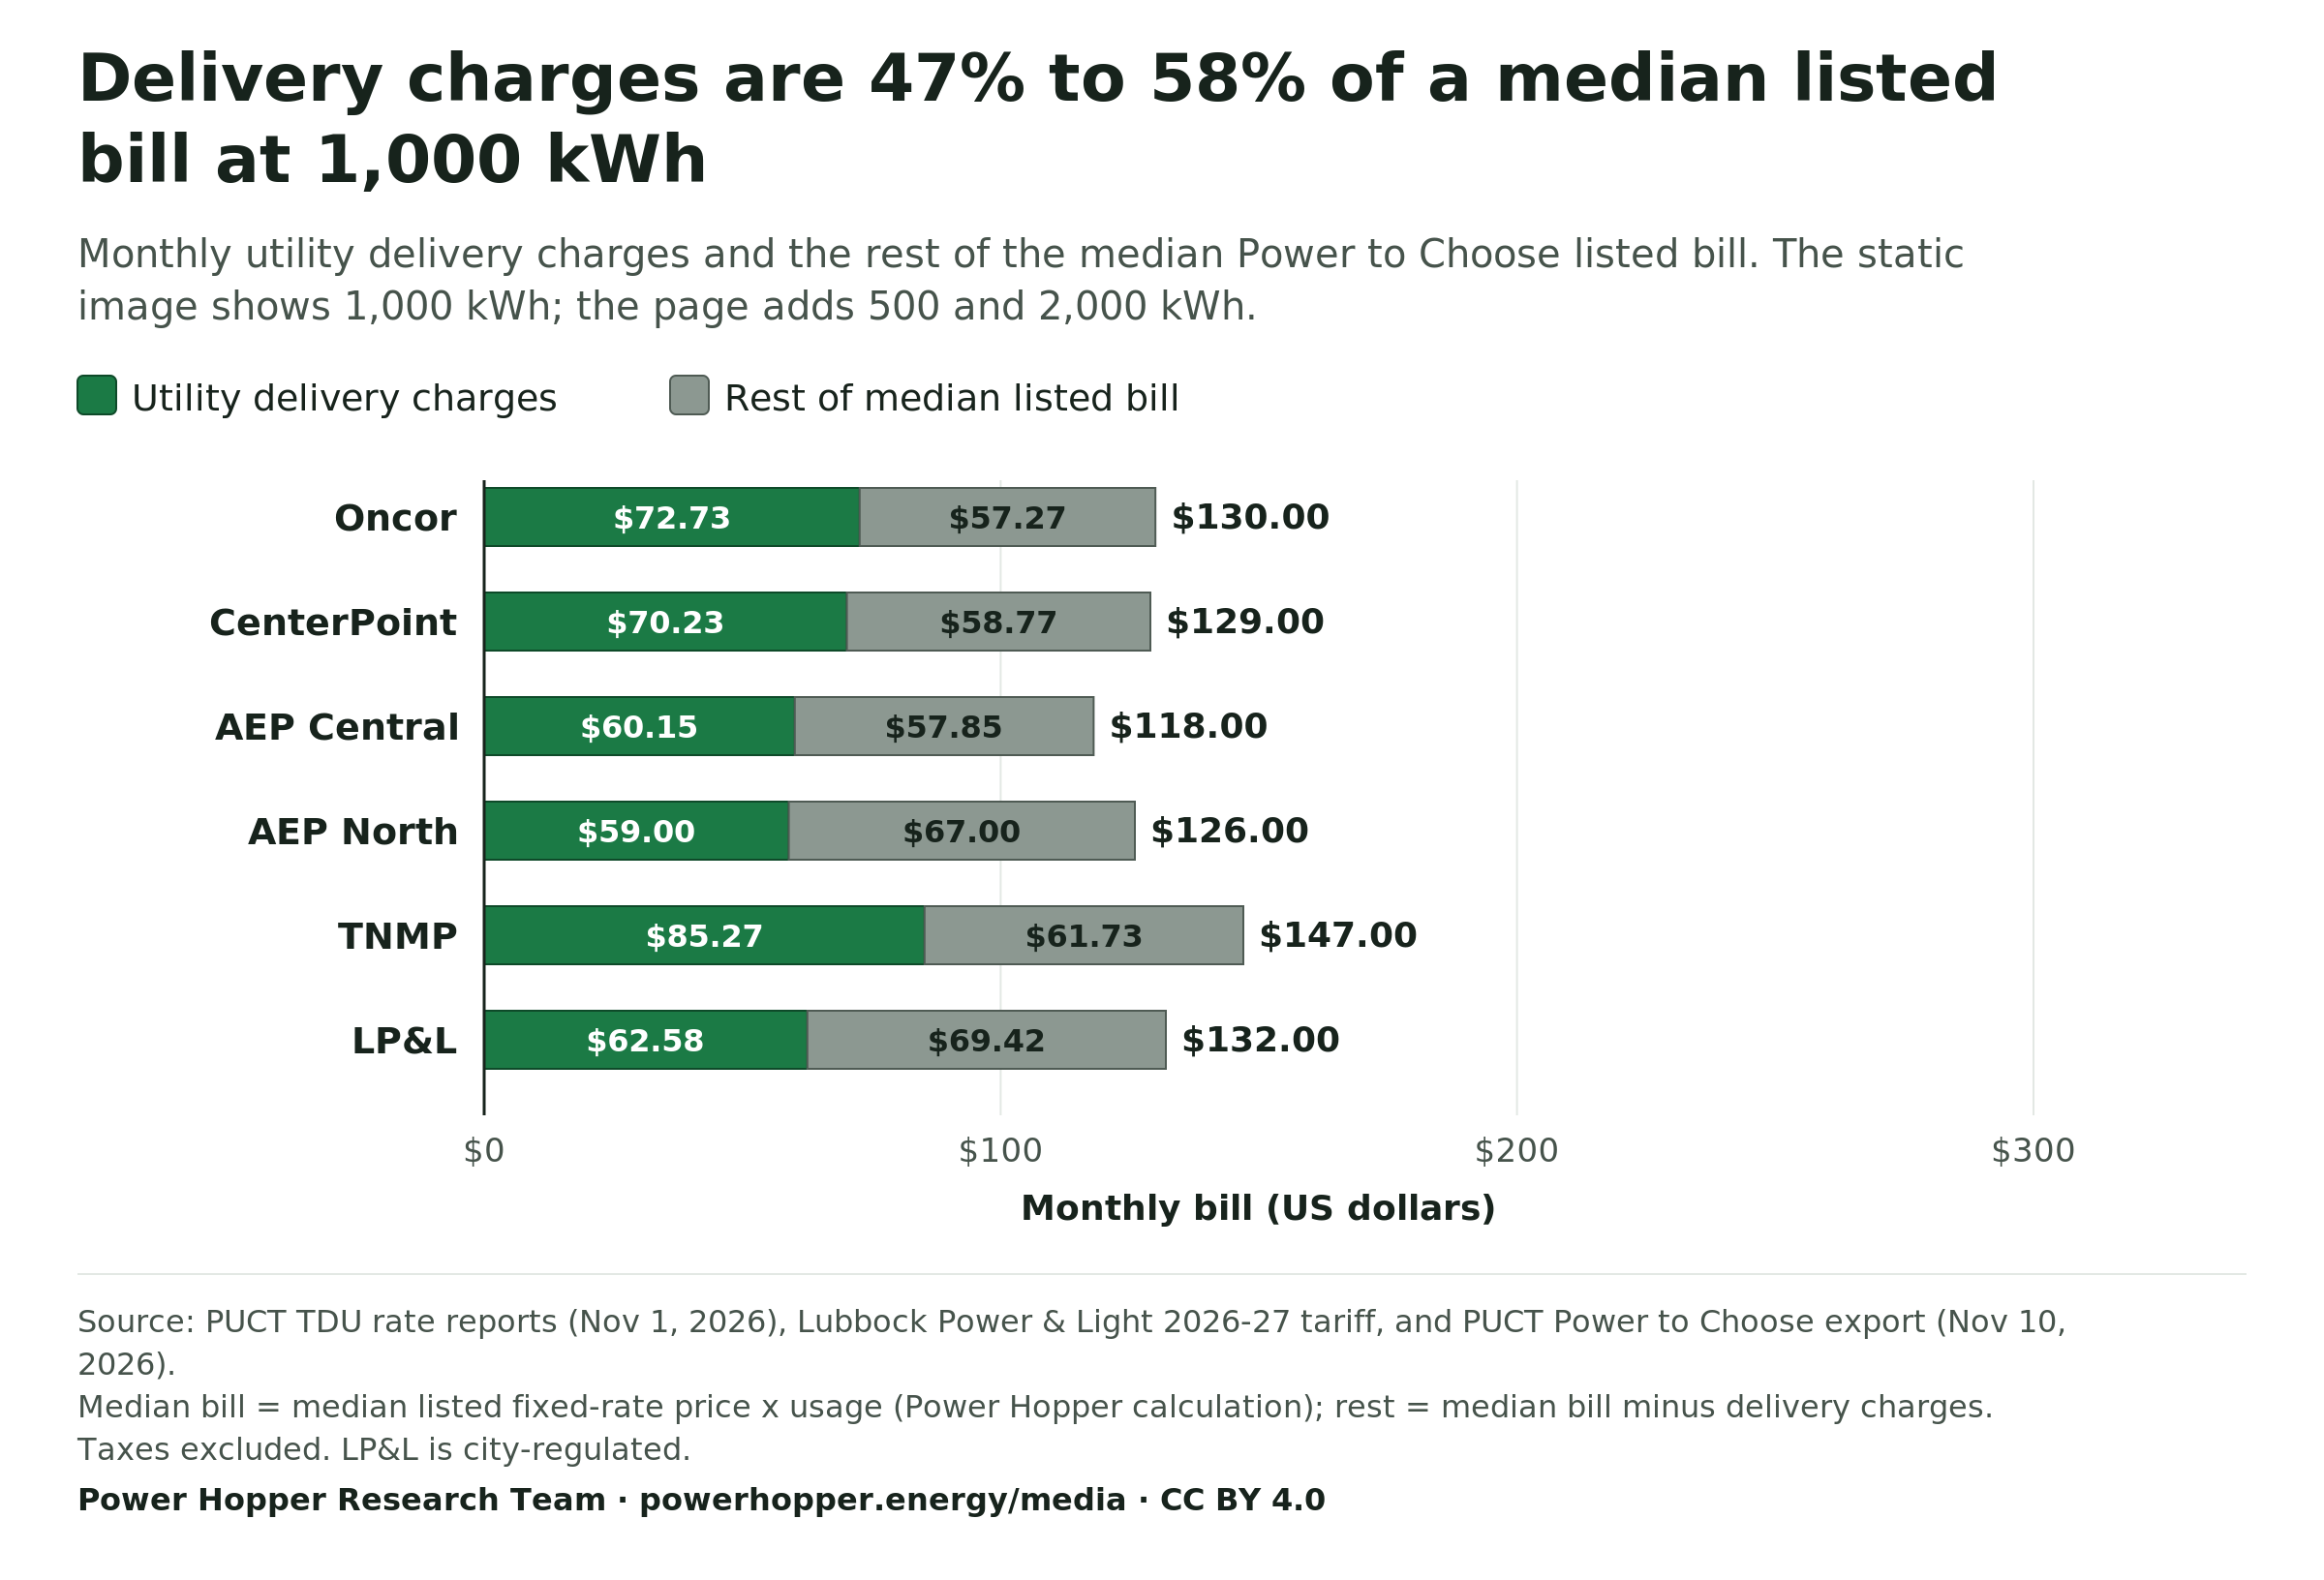
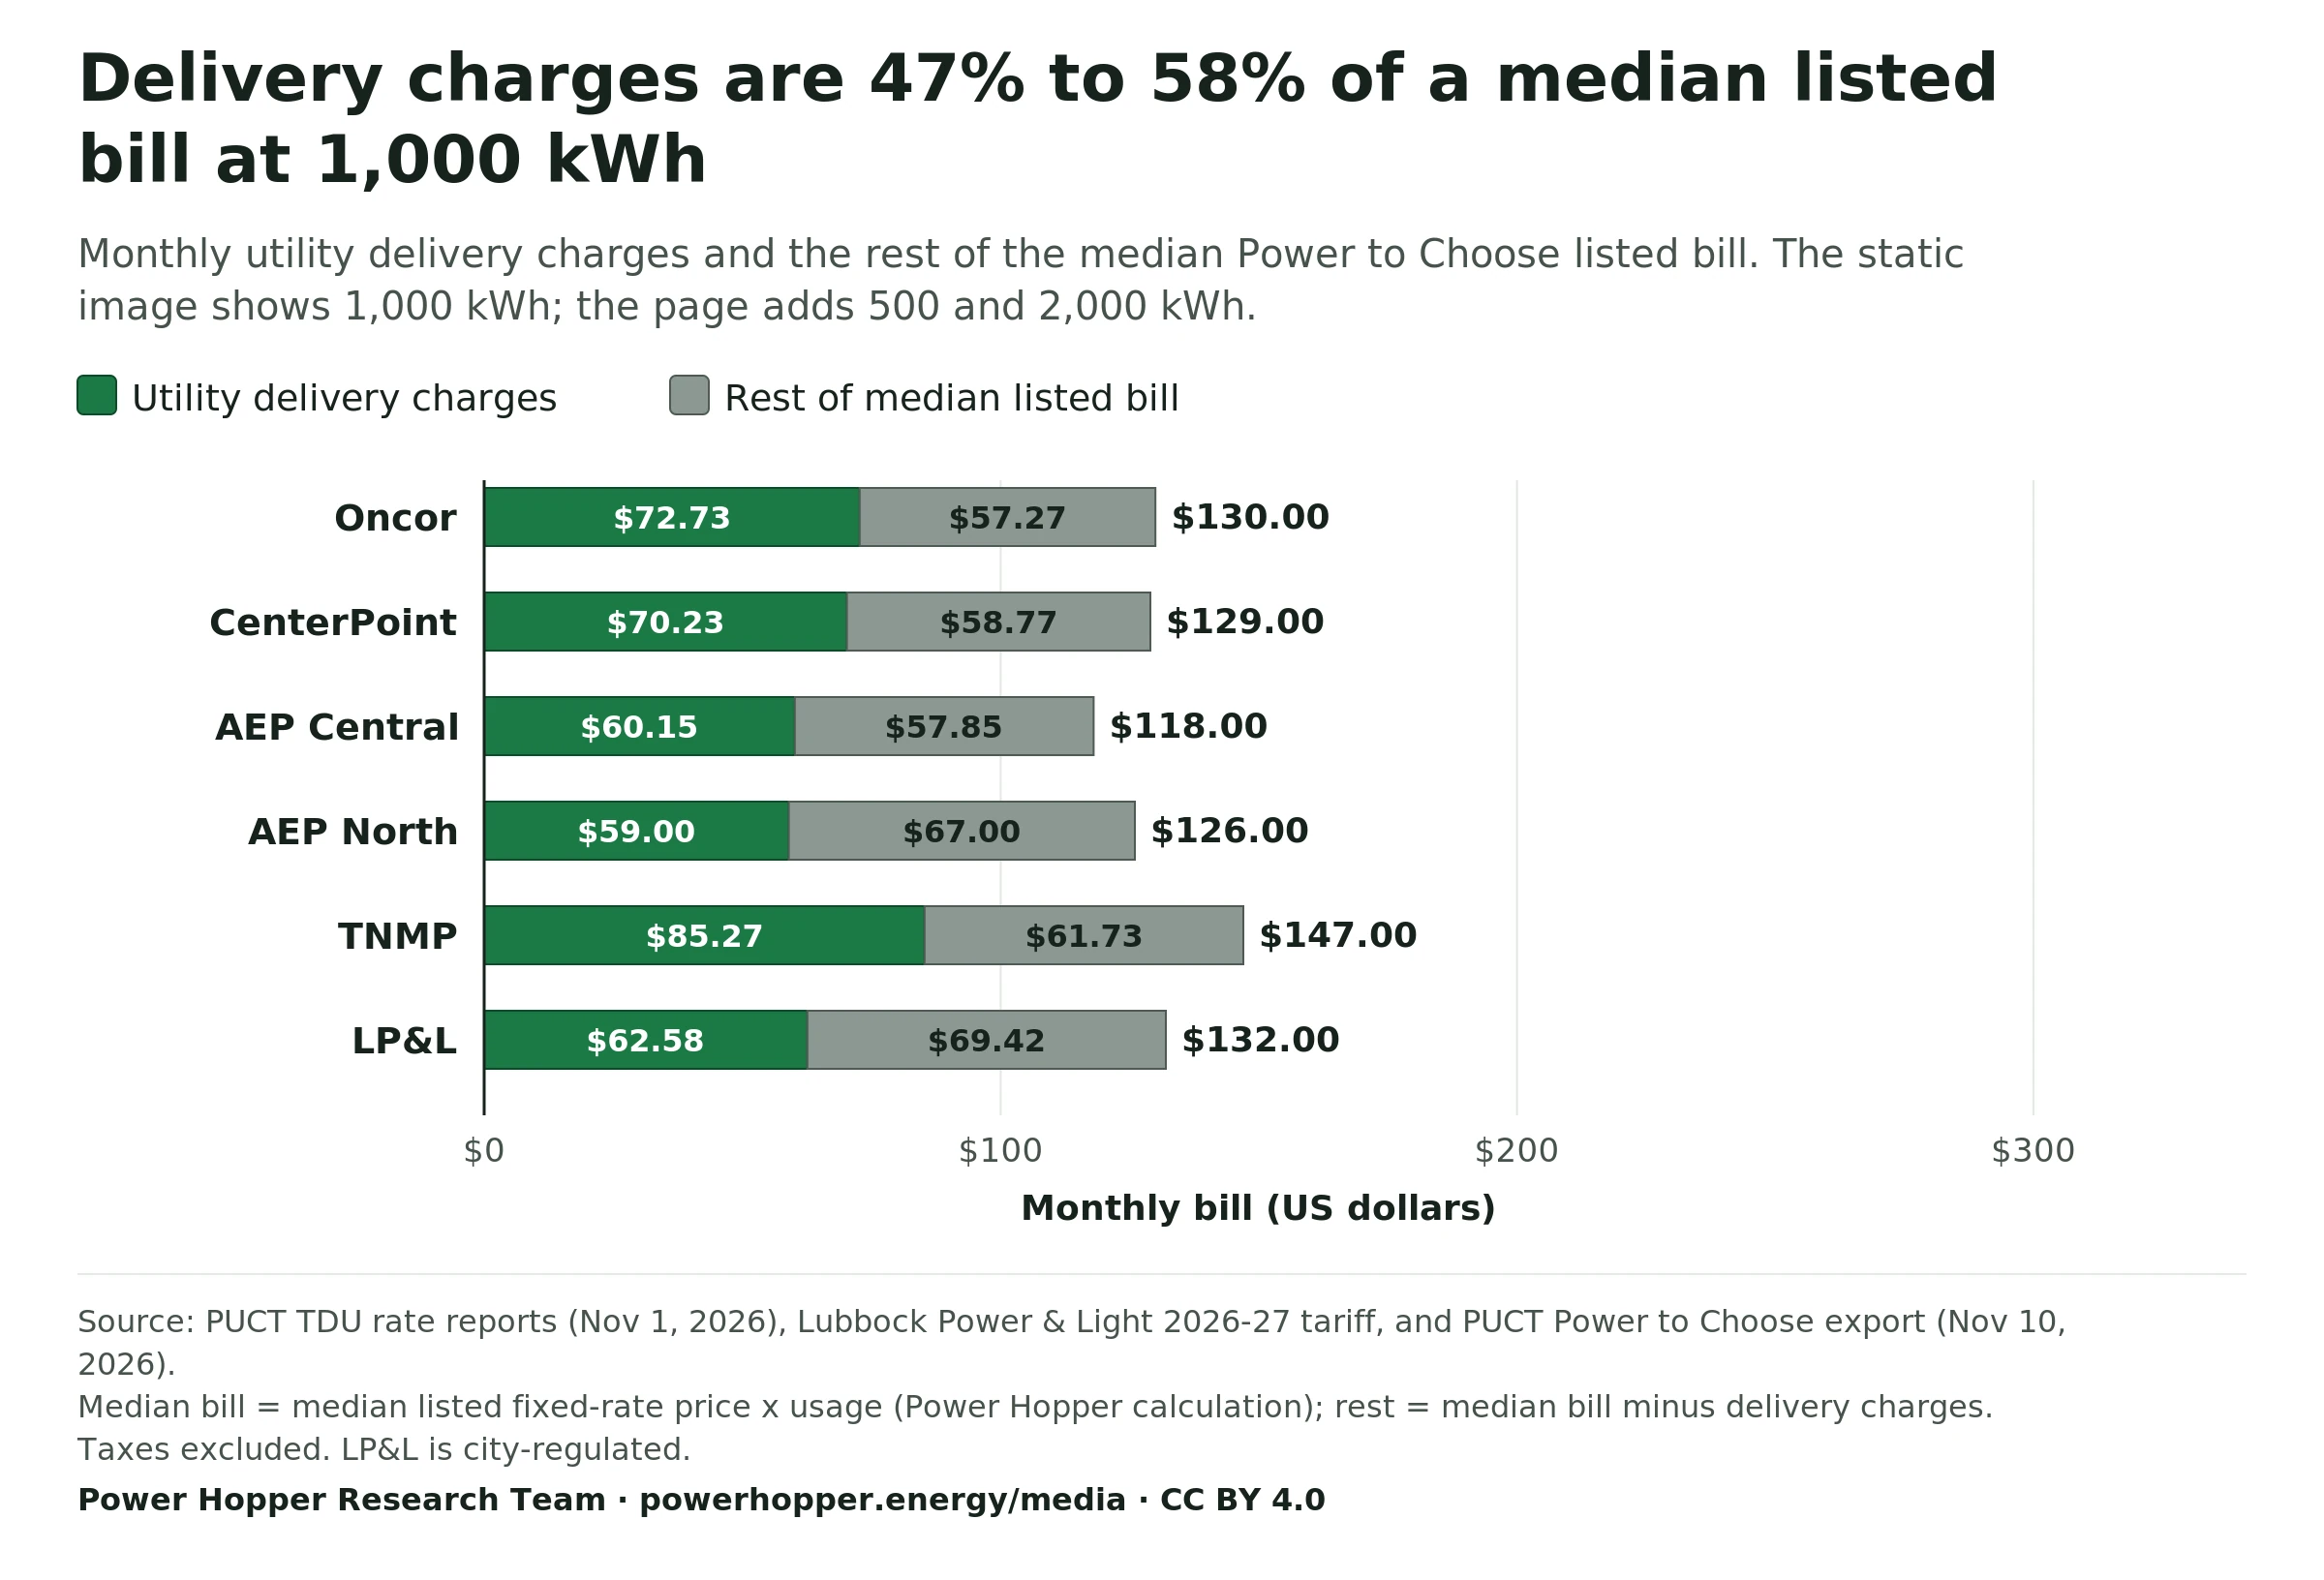
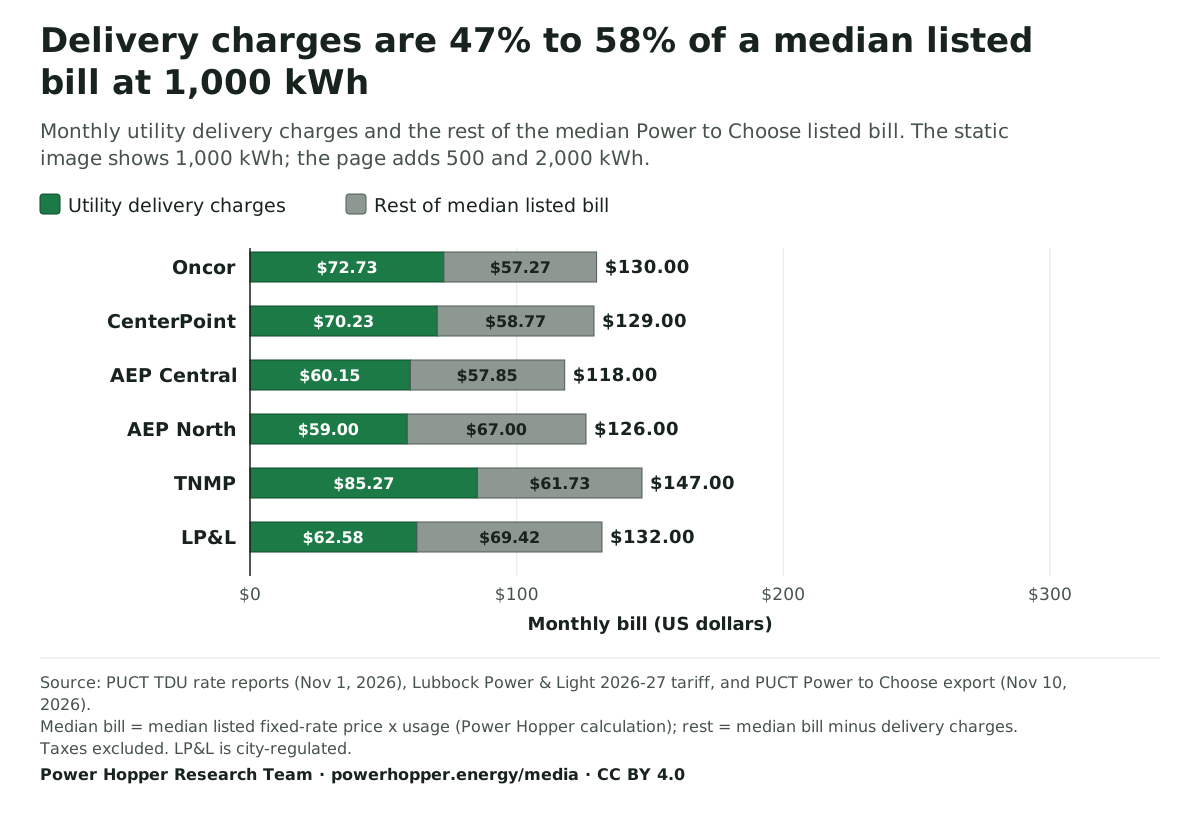
Delivery charges are 47% to 58% of a median listed bill at 1,000 kWh
Monthly utility delivery charges and the rest of the median Power to Choose listed bill. The static image shows 1,000 kWh; the page adds 500 and 2,000 kWh.
- Utility delivery charges
- Rest of median listed bill
At 500 kWh, delivery charges are 47% to 59% of the median listed bill.
Monthly bill (US dollars)
At 1,000 kWh, delivery charges are 47% to 58% of the median listed bill.
Monthly bill (US dollars)
At 2,000 kWh, delivery charges are 46% to 56% of the median listed bill.
Monthly bill (US dollars)
Source: PUCT TDU rate reports (Nov 1, 2026), Lubbock Power & Light 2026-27 tariff, and PUCT Power to Choose export (Nov 10, 2026). Median bill = median listed fixed-rate price x usage (Power Hopper calculation); rest = median bill minus delivery charges. Taxes excluded. LP&L is city-regulated.
Download PNG of Utility delivery charges vs the rest of the median listed bill, by utility (500, 1,000 and 2,000 kWh) WebP of Utility delivery charges vs the rest of the median listed bill, by utility (500, 1,000 and 2,000 kWh) SVG of Utility delivery charges vs the rest of the median listed bill, by utility (500, 1,000 and 2,000 kWh)
Cite this chart
Power Hopper Research Team. "Utility delivery charges vs the rest of the median listed bill, by utility (500, 1,000 and 2,000 kWh)." Chart. Texas Residential Delivery Charges by Utility dataset. Power Hopper Media Data Room, published November 10, 2026. https://powerhopper.energy/media/charts#chart-texas-median-listed-bill-delivery-vs-rest-1000-kwh-2026-11-10. Accessed [date accessed].
Data table
| Delivery utility | 500 kWh: Utility delivery charges | 500 kWh: Rest of median listed bill | 1,000 kWh: Utility delivery charges | 1,000 kWh: Rest of median listed bill | 2,000 kWh: Utility delivery charges | 2,000 kWh: Rest of median listed bill |
|---|---|---|---|---|---|---|
| Oncor | $38.40 | $30.60 | $72.73 | $57.27 | $141.41 | $116.59 |
| CenterPoint | $37.57 | $31.43 | $70.23 | $58.77 | $135.57 | $120.43 |
| AEP Central | $31.69 | $29.81 | $60.15 | $57.85 | $117.05 | $116.95 |
| AEP North | $31.12 | $35.38 | $59.00 | $67.00 | $114.76 | $135.24 |
| TNMP | $46.42 | $32.58 | $85.27 | $61.73 | $162.98 | $127.02 |
| LP&L | $32.54 | $36.96 | $62.58 | $69.42 | $122.66 | $145.34 |
Utility Delivery Charges · Sep 1 to Nov 1, 2026
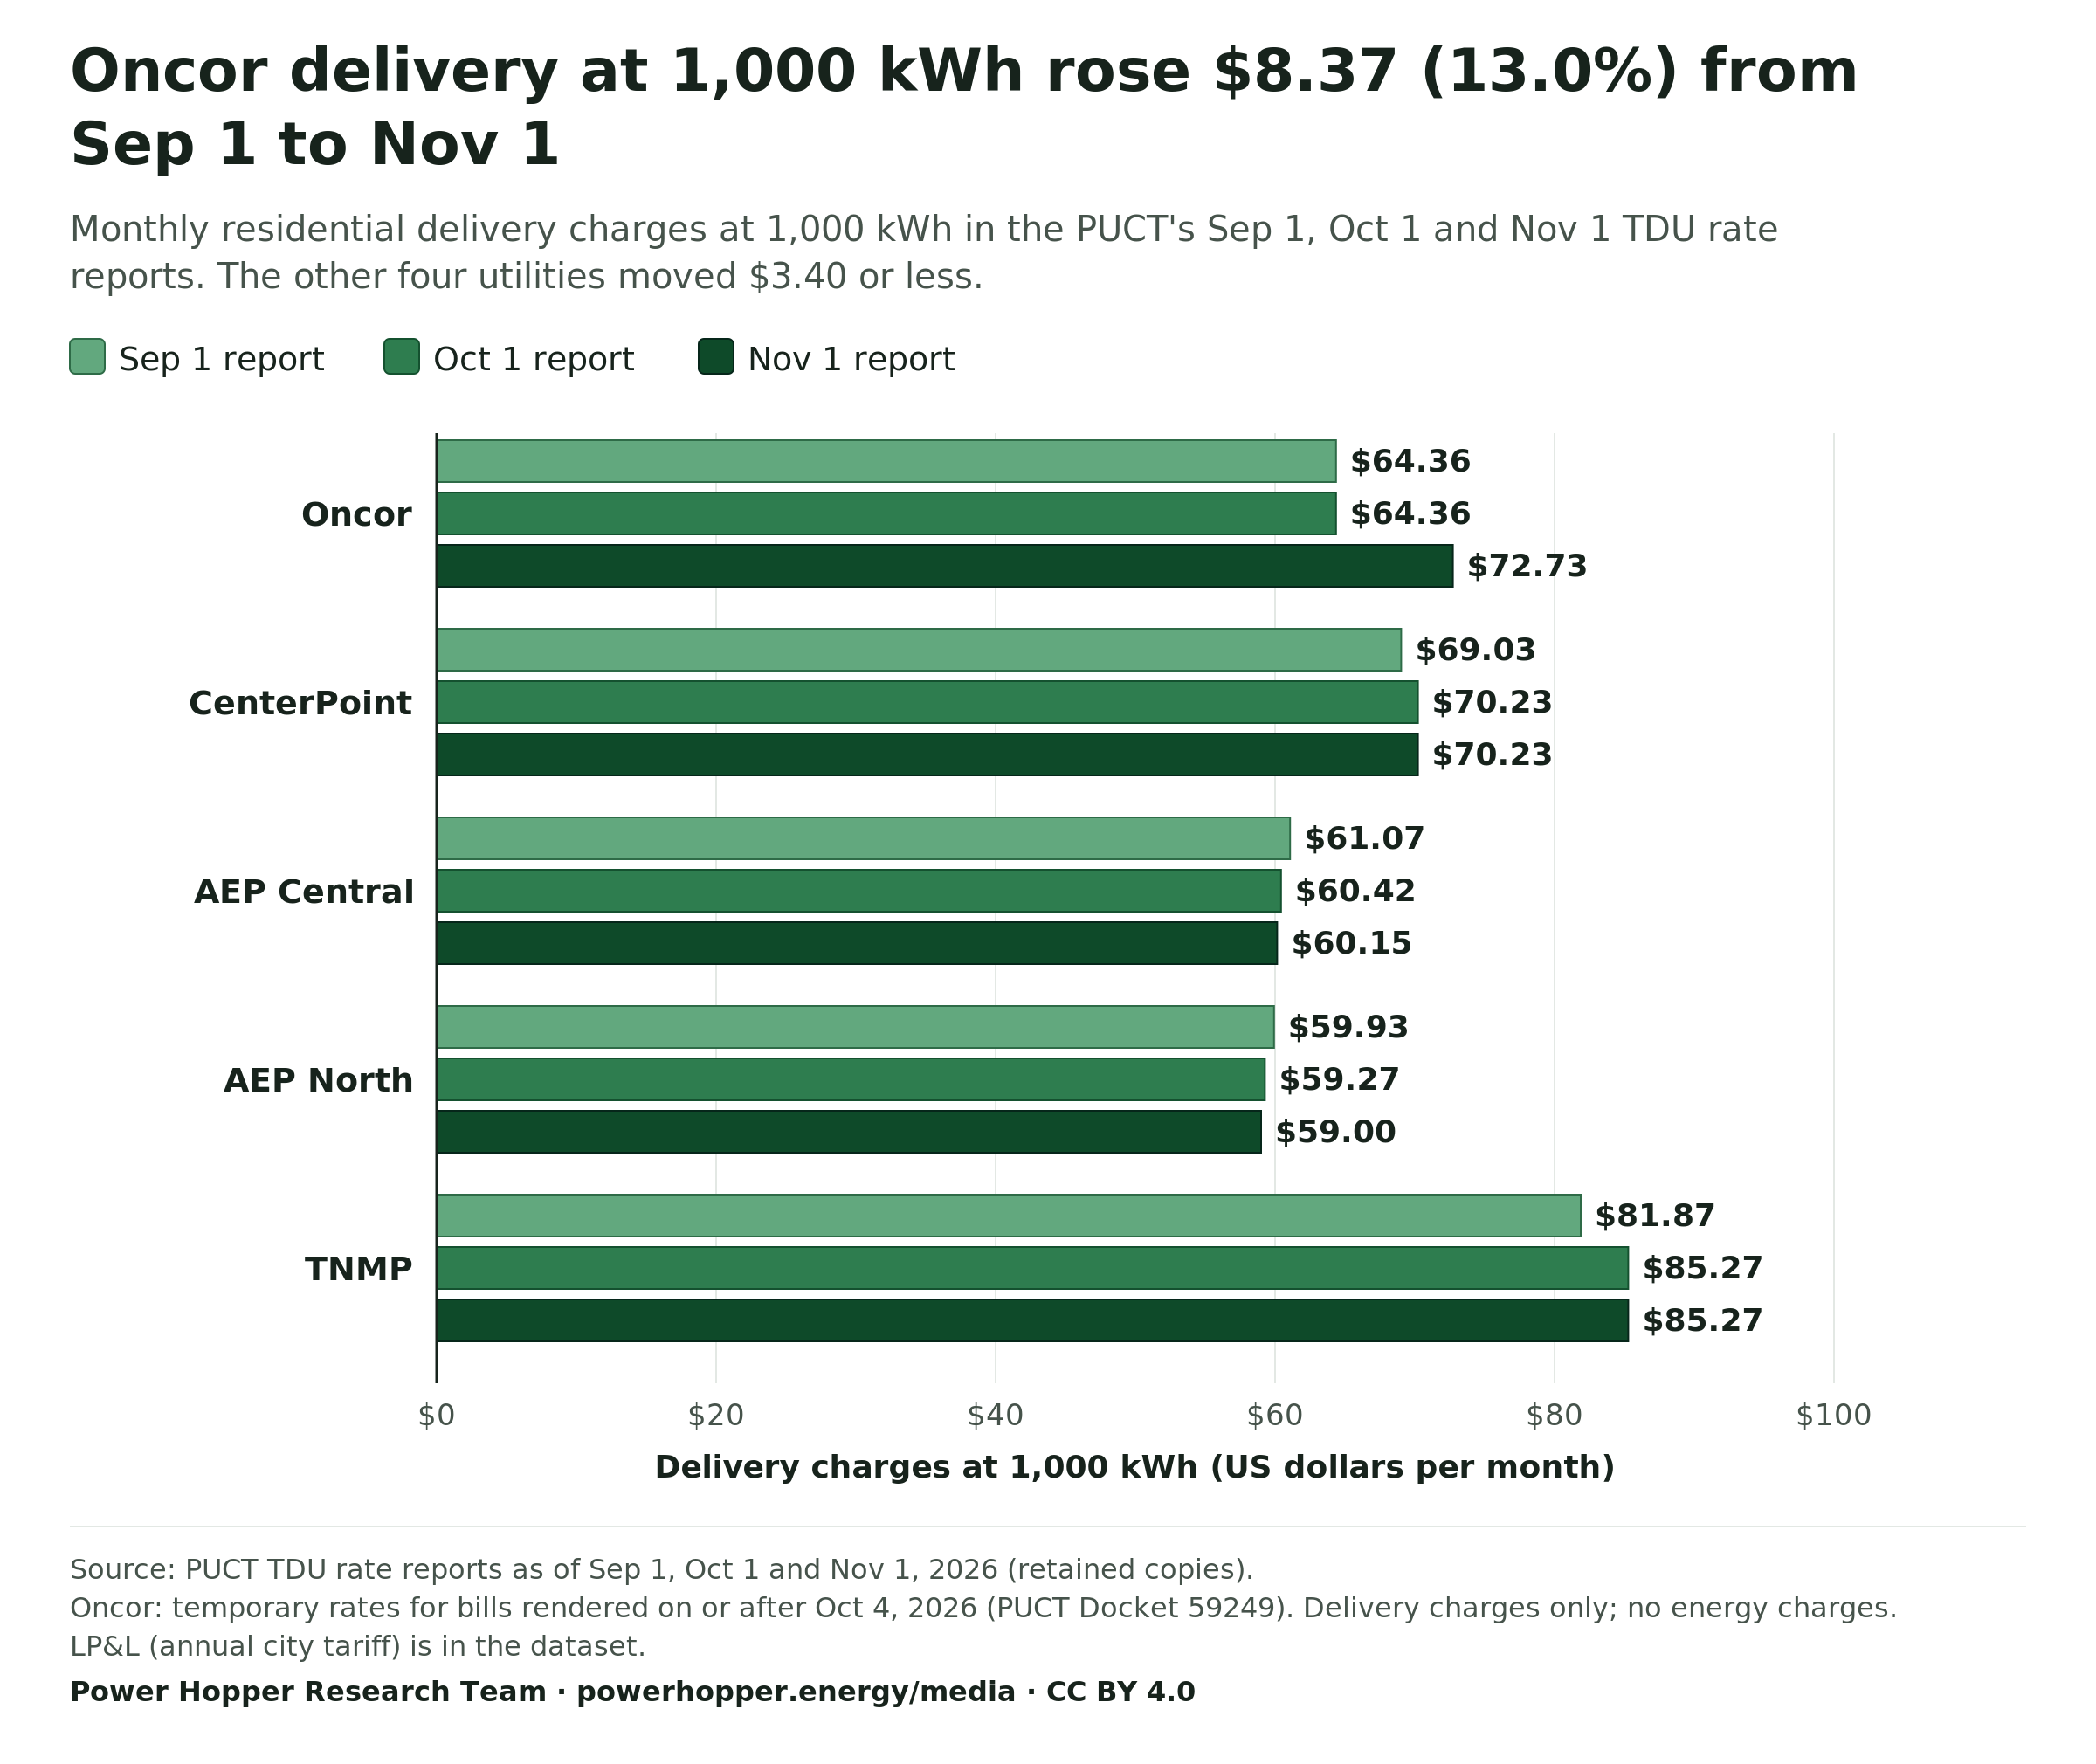
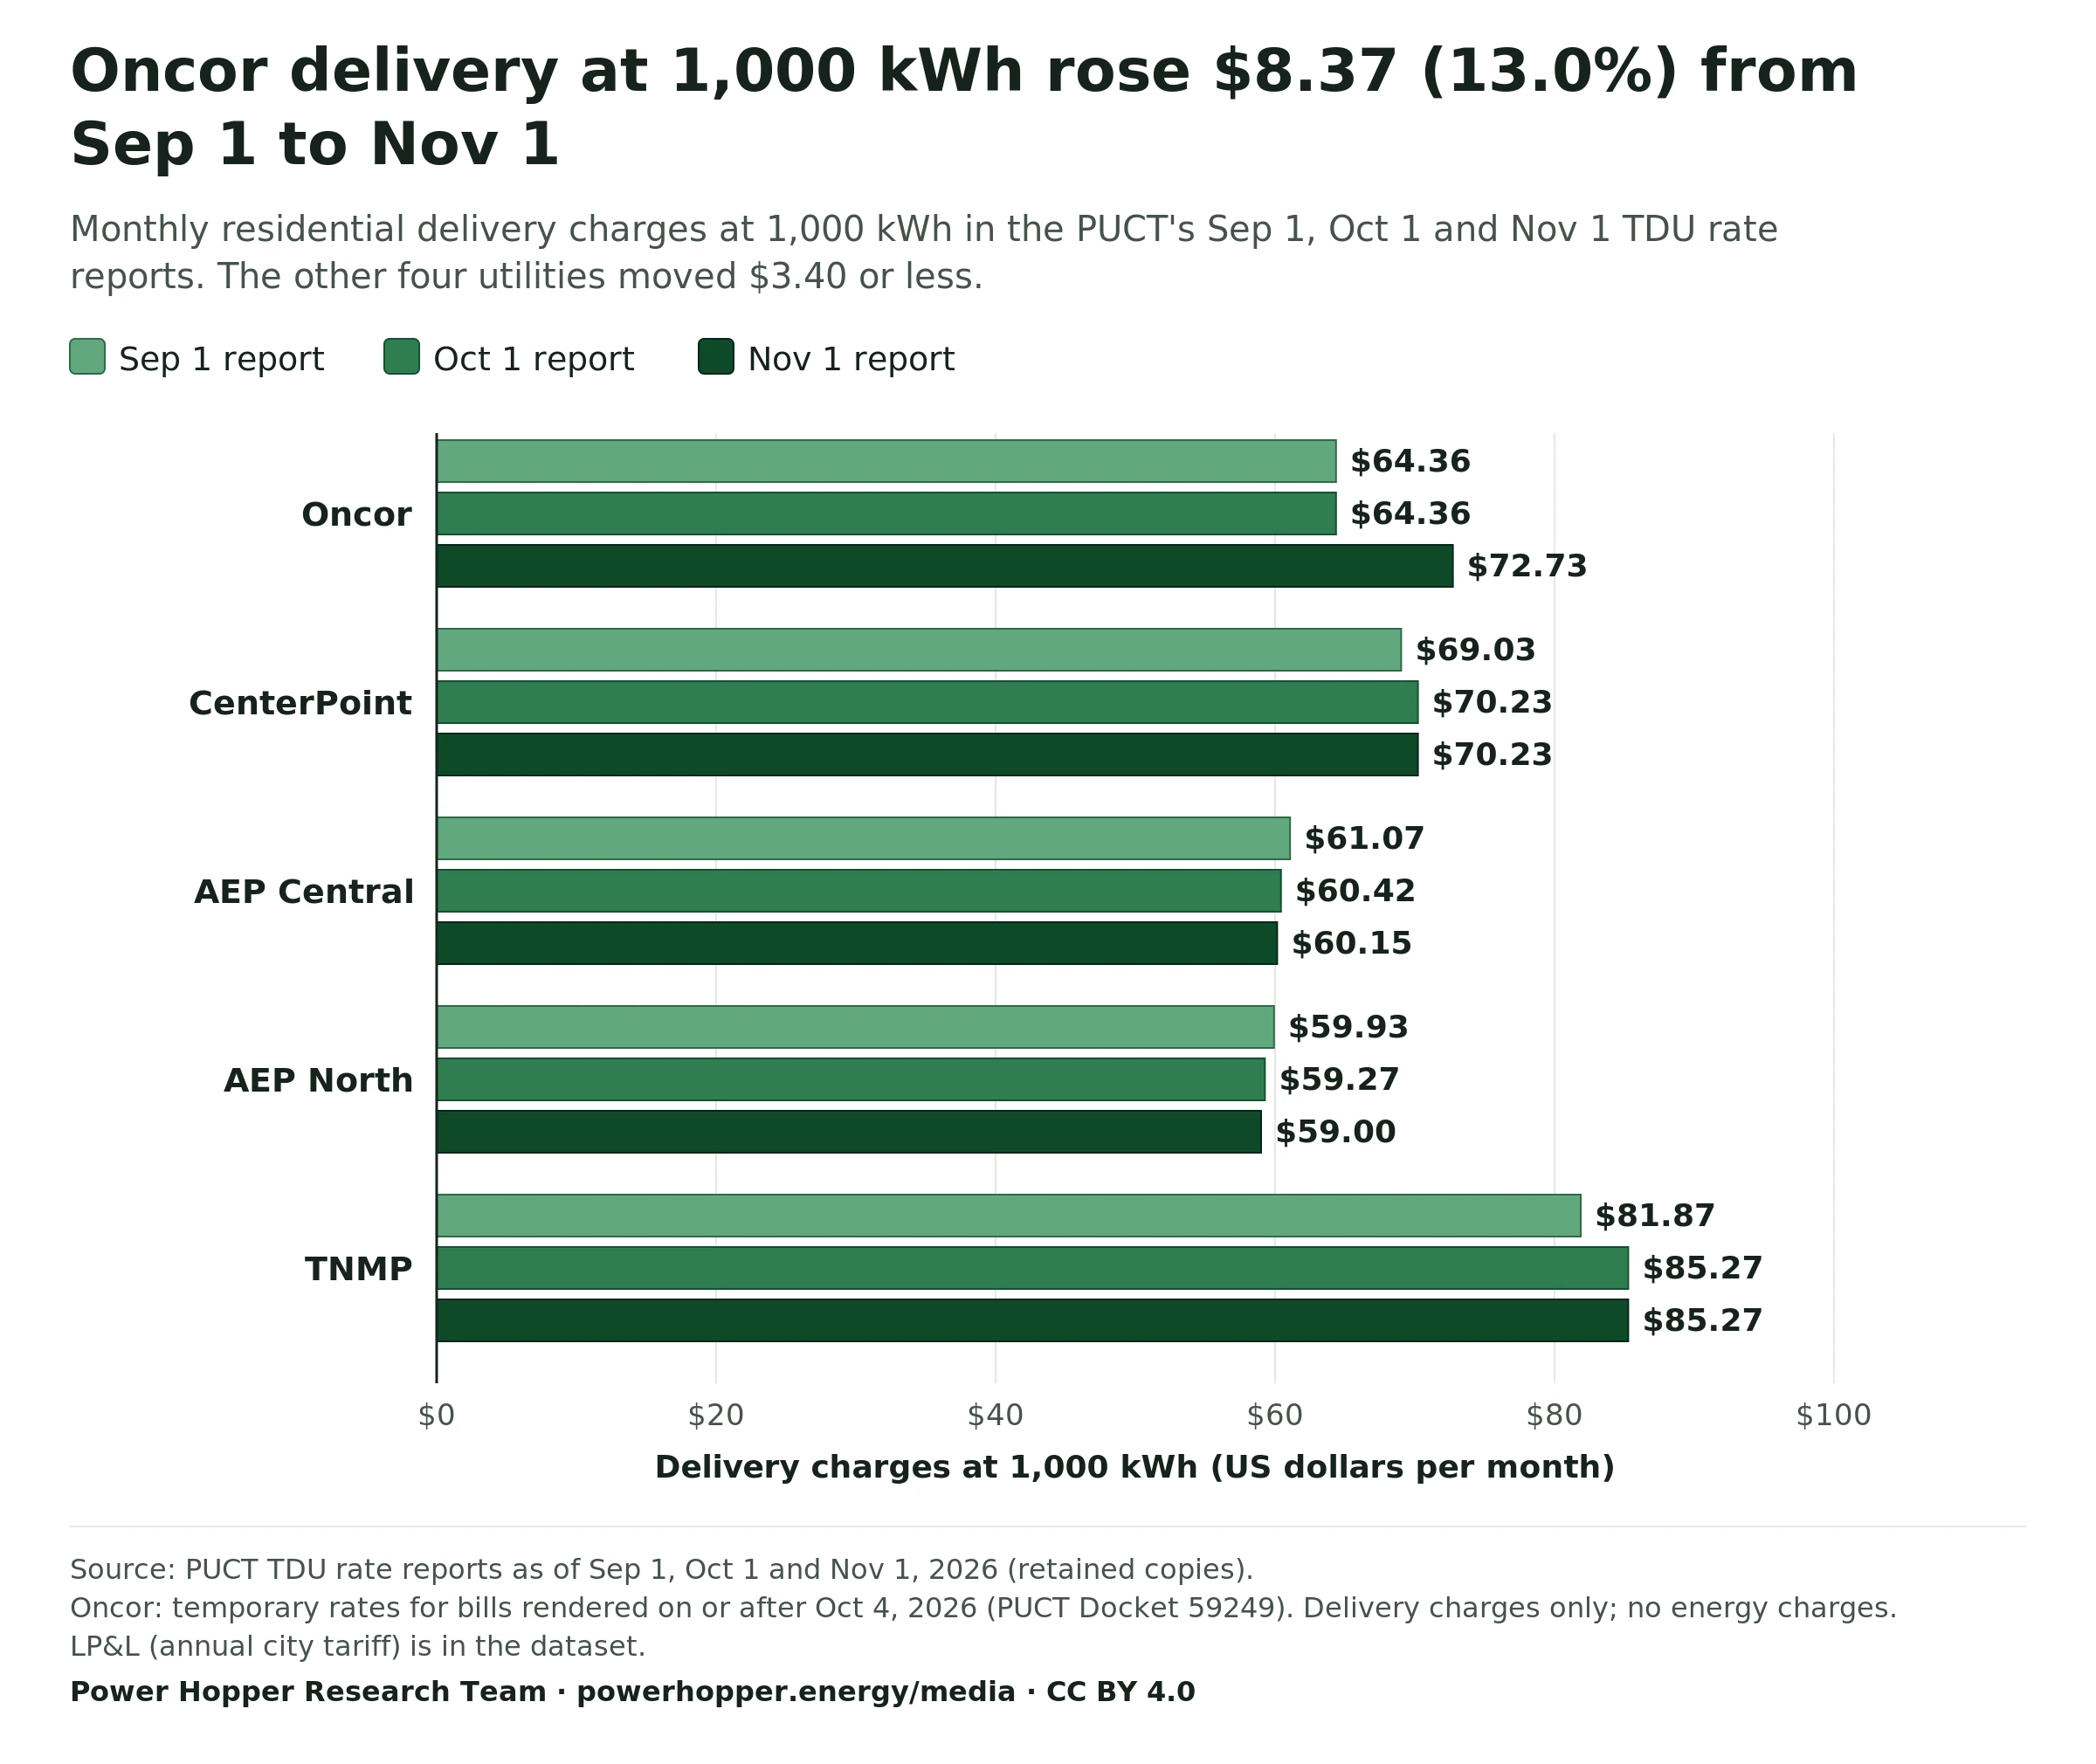
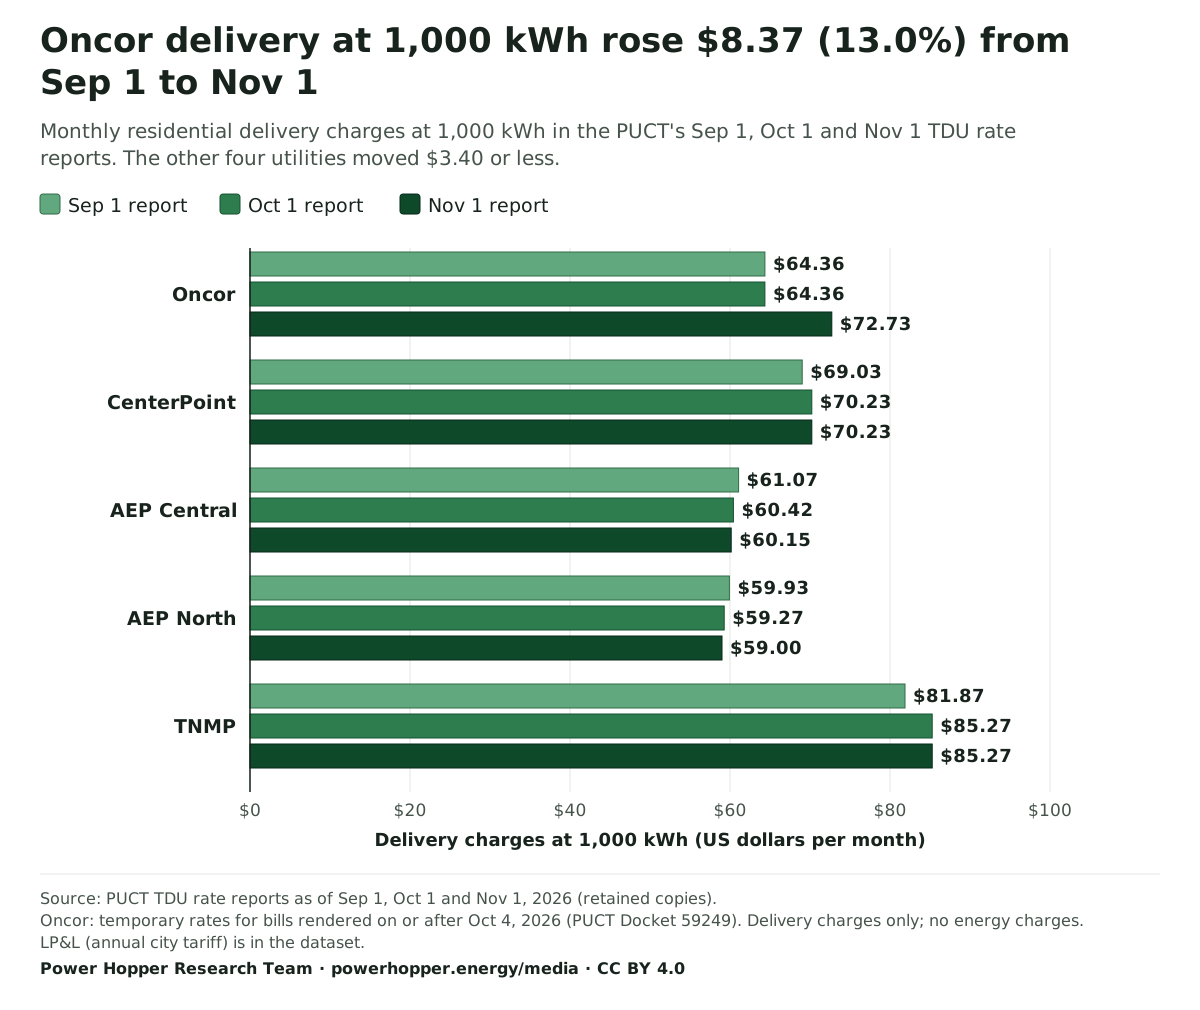
Oncor delivery at 1,000 kWh rose $8.37 (13.0%) from Sep 1 to Nov 1
Monthly residential delivery charges at 1,000 kWh in the PUCT's Sep 1, Oct 1 and Nov 1 TDU rate reports. The other four utilities moved $3.40 or less.
- Sep 1 report
- Oct 1 report
- Nov 1 report
Delivery charges at 1,000 kWh (US dollars per month)
Source: PUCT TDU rate reports as of Sep 1, Oct 1 and Nov 1, 2026 (retained copies). Oncor: temporary rates for bills rendered on or after Oct 4, 2026 (PUCT Docket 59249). Delivery charges only; no energy charges. LP&L (annual city tariff) is in the dataset.
Download PNG of Residential delivery charges at 1,000 kWh, Sep to Nov 2026, by utility WebP of Residential delivery charges at 1,000 kWh, Sep to Nov 2026, by utility SVG of Residential delivery charges at 1,000 kWh, Sep to Nov 2026, by utility
Cite this chart
Power Hopper Research Team. "Residential delivery charges at 1,000 kWh, Sep to Nov 2026, by utility." Chart. Texas Residential Delivery Charge History, Sep to Nov 2026 dataset. Power Hopper Media Data Room, published November 10, 2026. https://powerhopper.energy/media/charts#chart-texas-residential-delivery-charges-1000-kwh-2026-09-to-2026-11. Accessed [date accessed].
Data table
| Delivery utility | Sep 1 report | Oct 1 report | Nov 1 report |
|---|---|---|---|
| Oncor | $64.36 | $64.36 | $72.73 |
| CenterPoint | $69.03 | $70.23 | $70.23 |
| AEP Central | $61.07 | $60.42 | $60.15 |
| AEP North | $59.93 | $59.27 | $59.00 |
| TNMP | $81.87 | $85.27 | $85.27 |
Plans, market and legislation
Plan Structure · Nov 10, 2026 snapshot
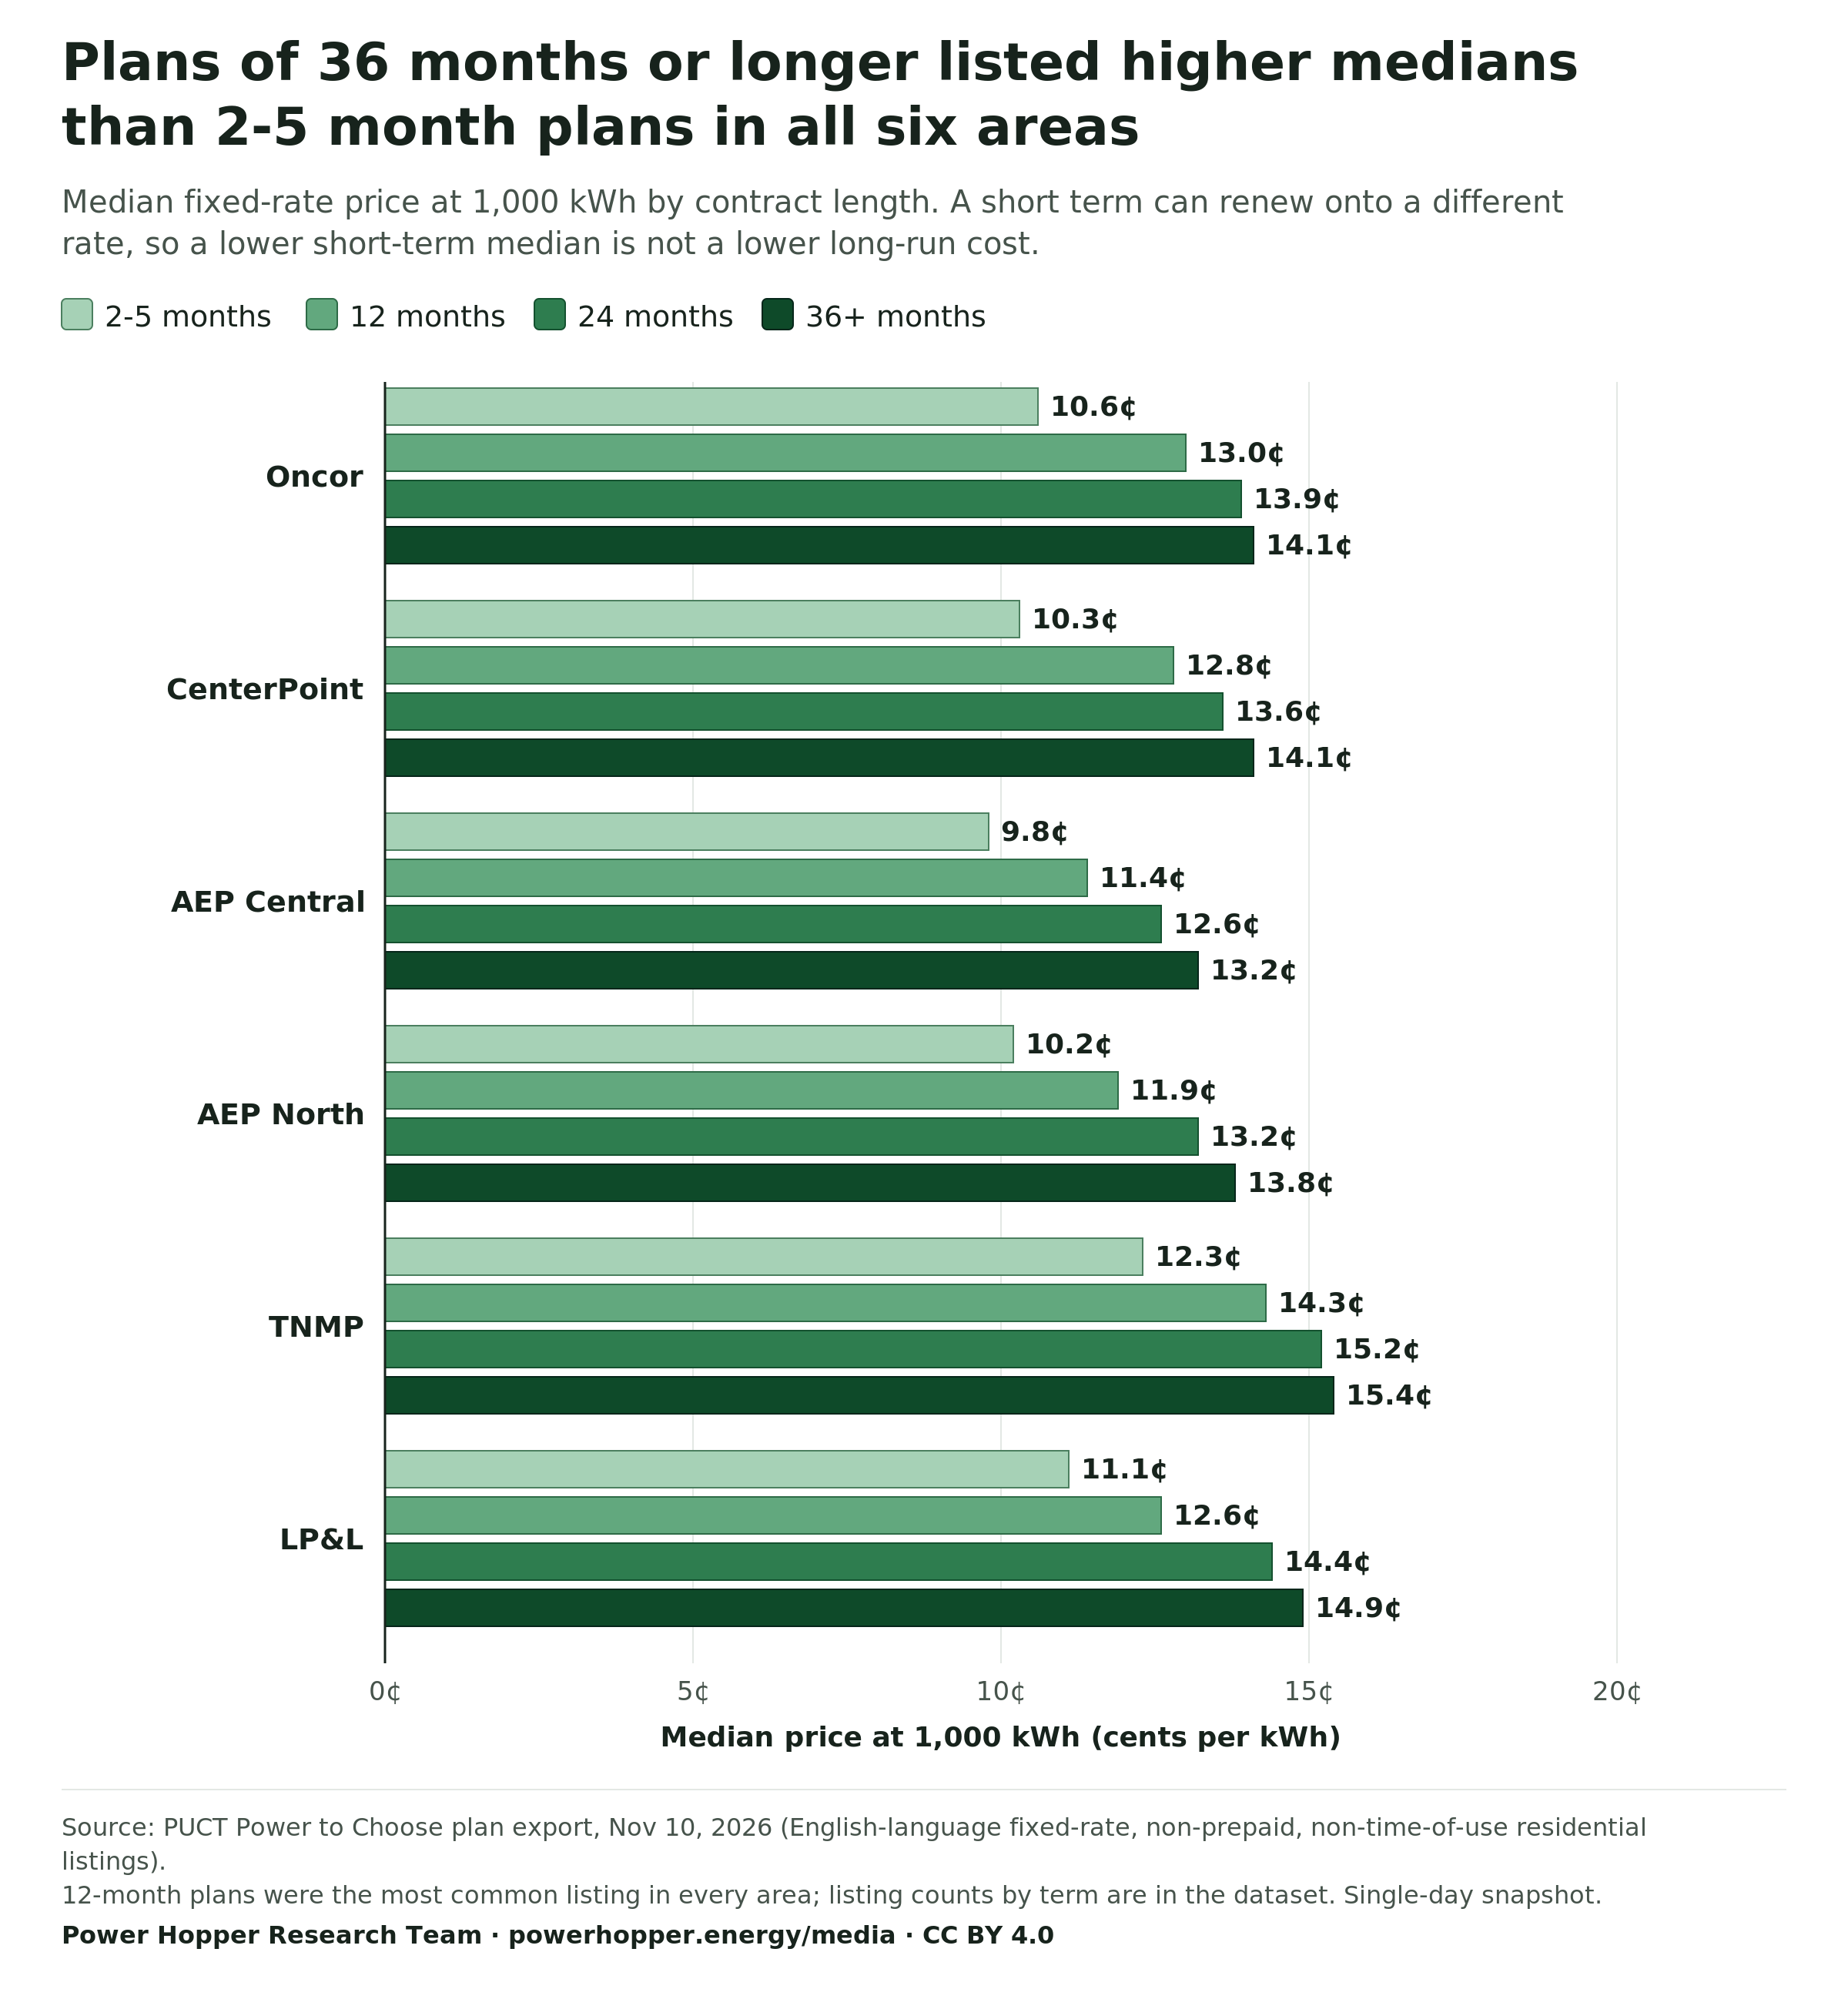
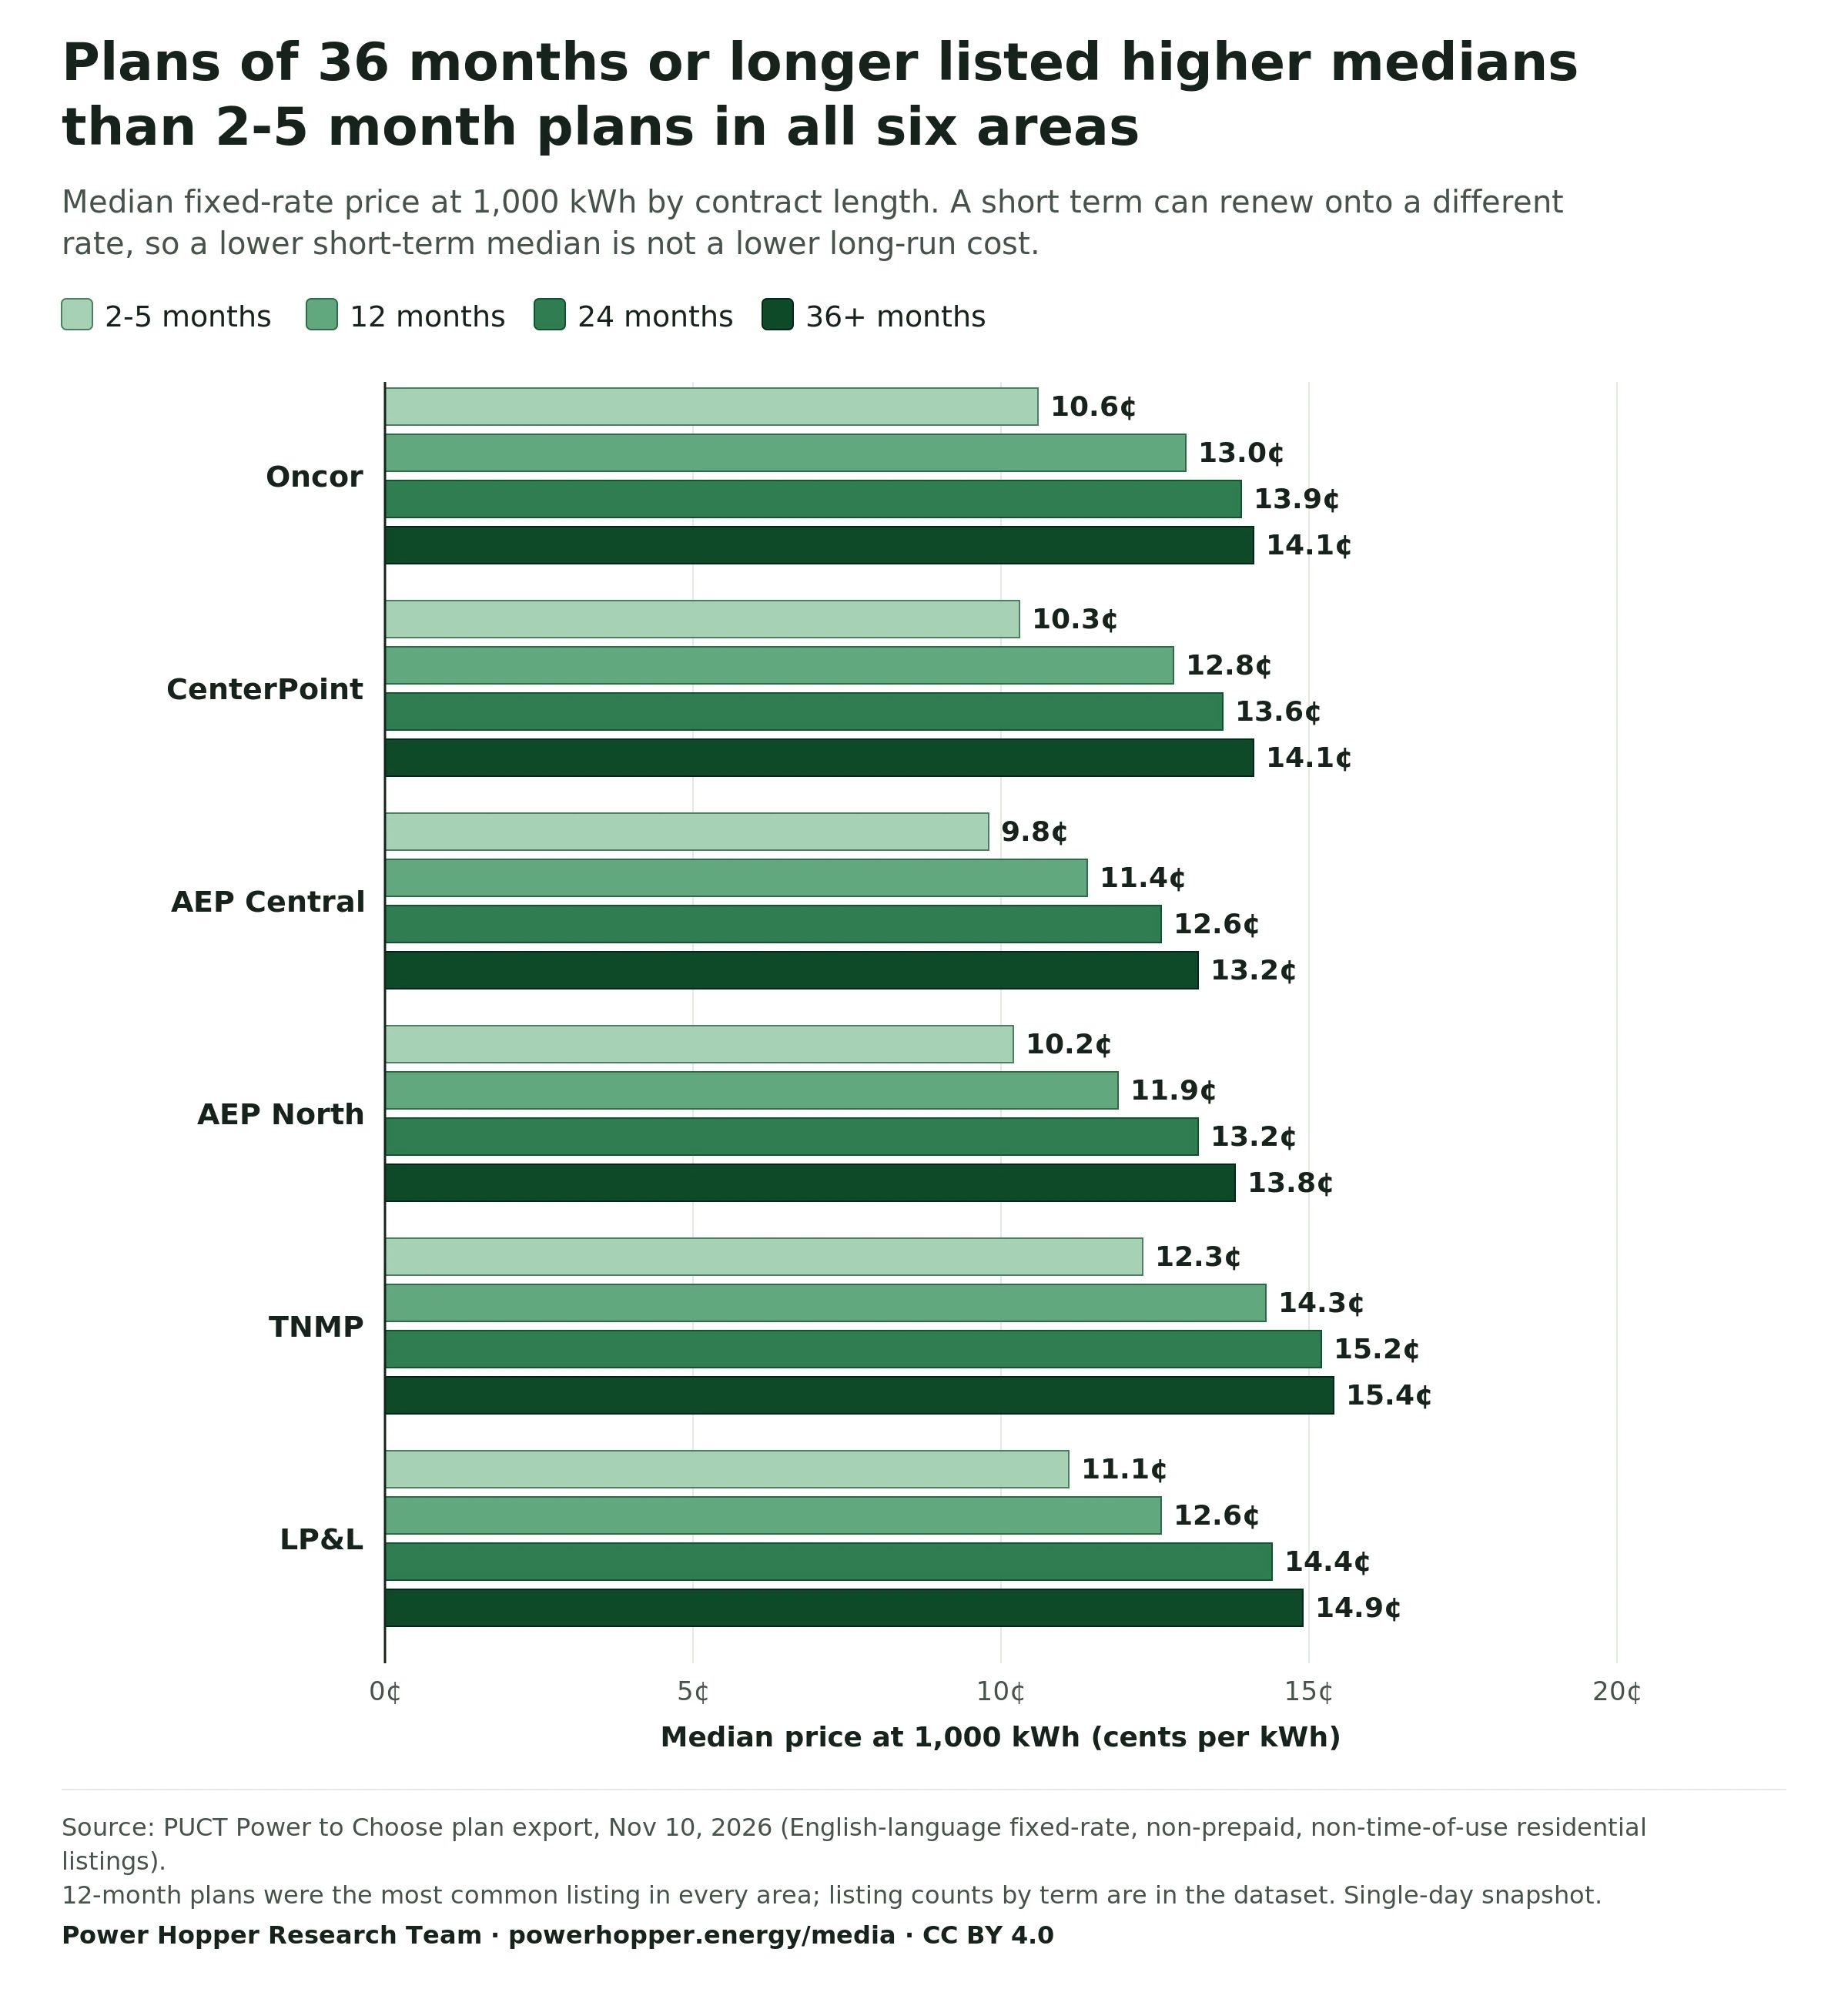
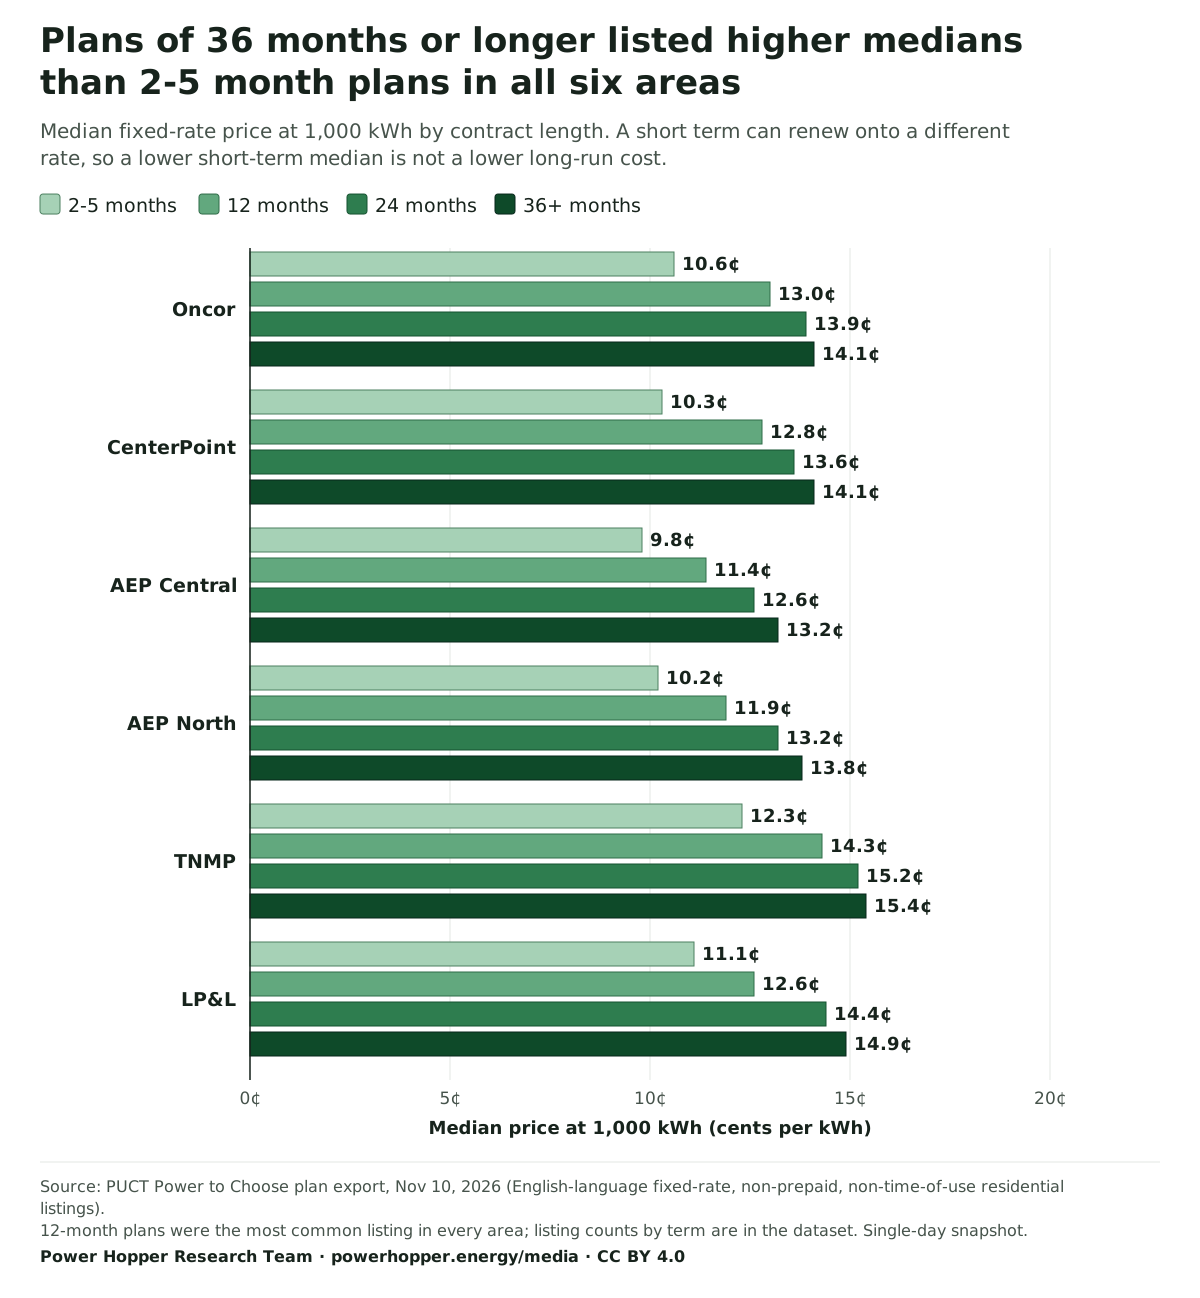
Plans of 36 months or longer listed higher medians than 2-5 month plans in all six areas
Median fixed-rate price at 1,000 kWh by contract length. A short term can renew onto a different rate, so a lower short-term median is not a lower long-run cost.
- 2-5 months
- 12 months
- 24 months
- 36+ months
Median price at 1,000 kWh (cents per kWh)
Source: PUCT Power to Choose plan export, Nov 10, 2026 (English-language fixed-rate, non-prepaid, non-time-of-use residential listings). 12-month plans were the most common listing in every area; listing counts by term are in the dataset. Single-day snapshot.
Download PNG of Median fixed-plan price at 1,000 kWh by contract term and utility, Nov 10, 2026 WebP of Median fixed-plan price at 1,000 kWh by contract term and utility, Nov 10, 2026 SVG of Median fixed-plan price at 1,000 kWh by contract term and utility, Nov 10, 2026
Cite this chart
Power Hopper Research Team. "Median fixed-plan price at 1,000 kWh by contract term and utility, Nov 10, 2026." Chart. Texas Electricity Plan Counts and Prices by Contract Term dataset. Power Hopper Media Data Room, published November 10, 2026. https://powerhopper.energy/media/charts#chart-texas-median-plan-price-by-contract-term-2026-11-10. Accessed [date accessed].
Data table
| Delivery utility | 2-5 months | 12 months | 24 months | 36+ months |
|---|---|---|---|---|
| Oncor | 10.6¢ | 13.0¢ | 13.9¢ | 14.1¢ |
| CenterPoint | 10.3¢ | 12.8¢ | 13.6¢ | 14.1¢ |
| AEP Central | 9.8¢ | 11.4¢ | 12.6¢ | 13.2¢ |
| AEP North | 10.2¢ | 11.9¢ | 13.2¢ | 13.8¢ |
| TNMP | 12.3¢ | 14.3¢ | 15.2¢ | 15.4¢ |
| LP&L | 11.1¢ | 12.6¢ | 14.4¢ | 14.9¢ |
Wholesale Market · Operating days Nov 2, 2026 to Nov 10, 2026
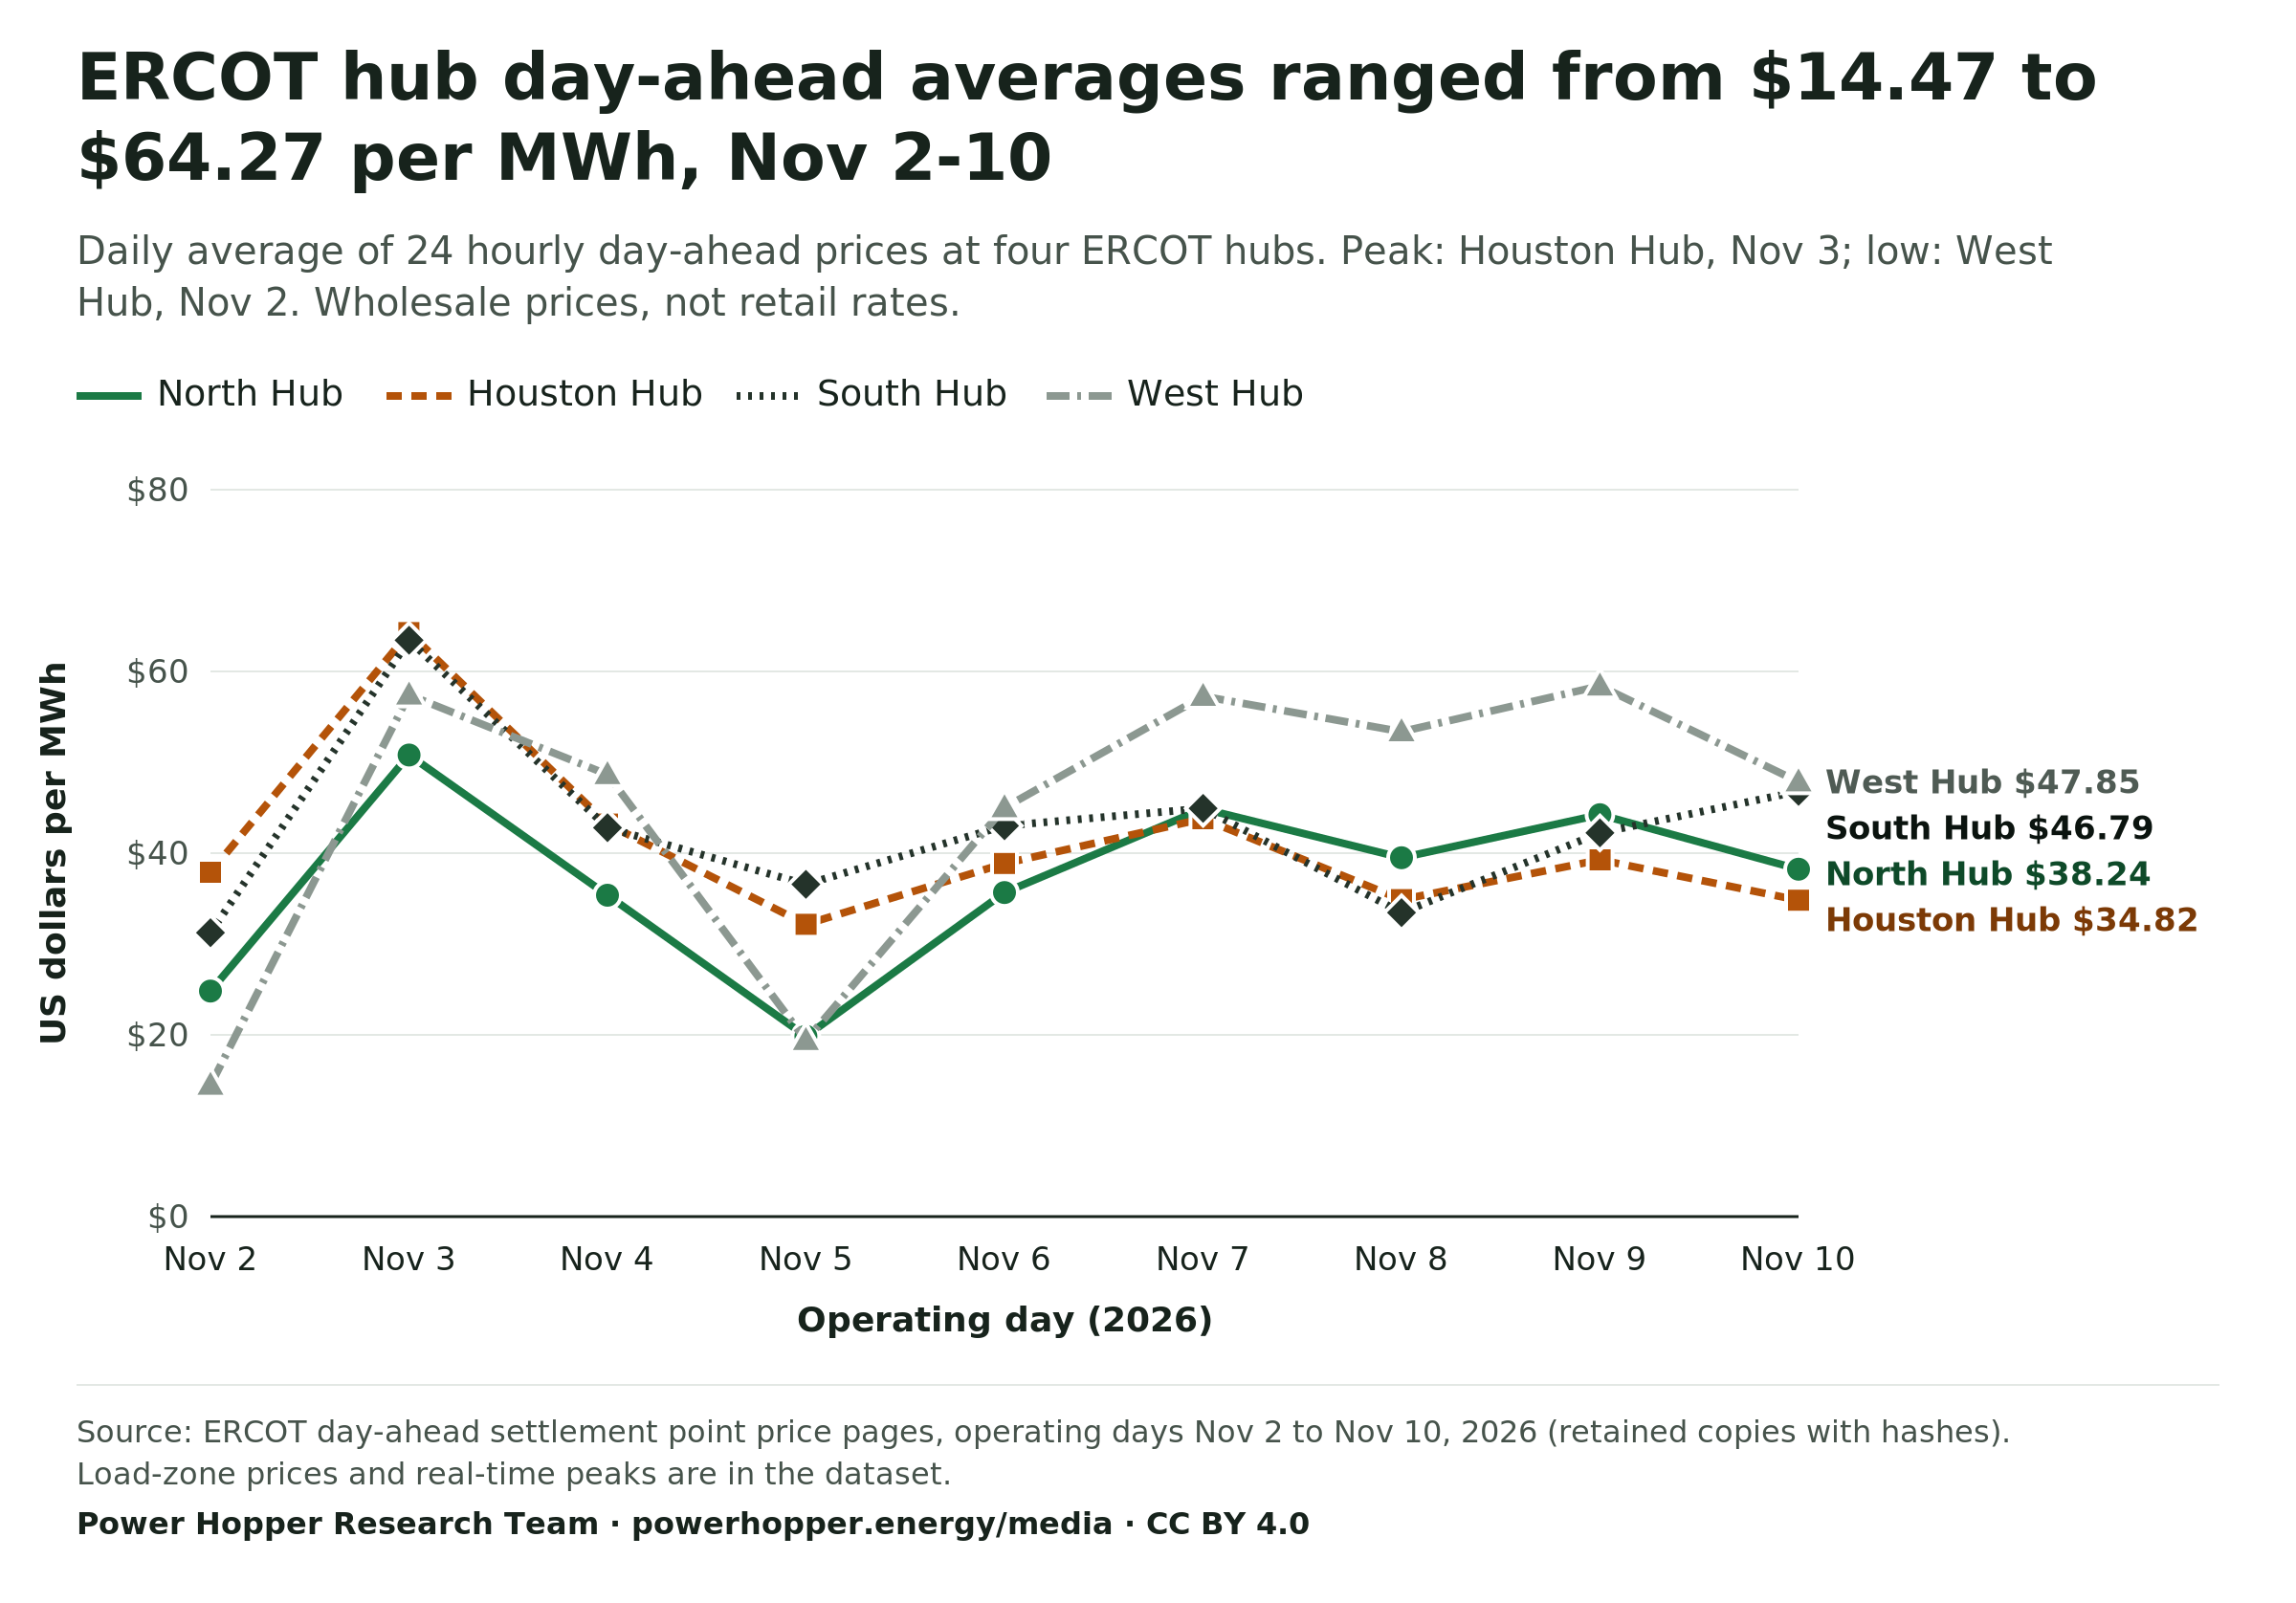
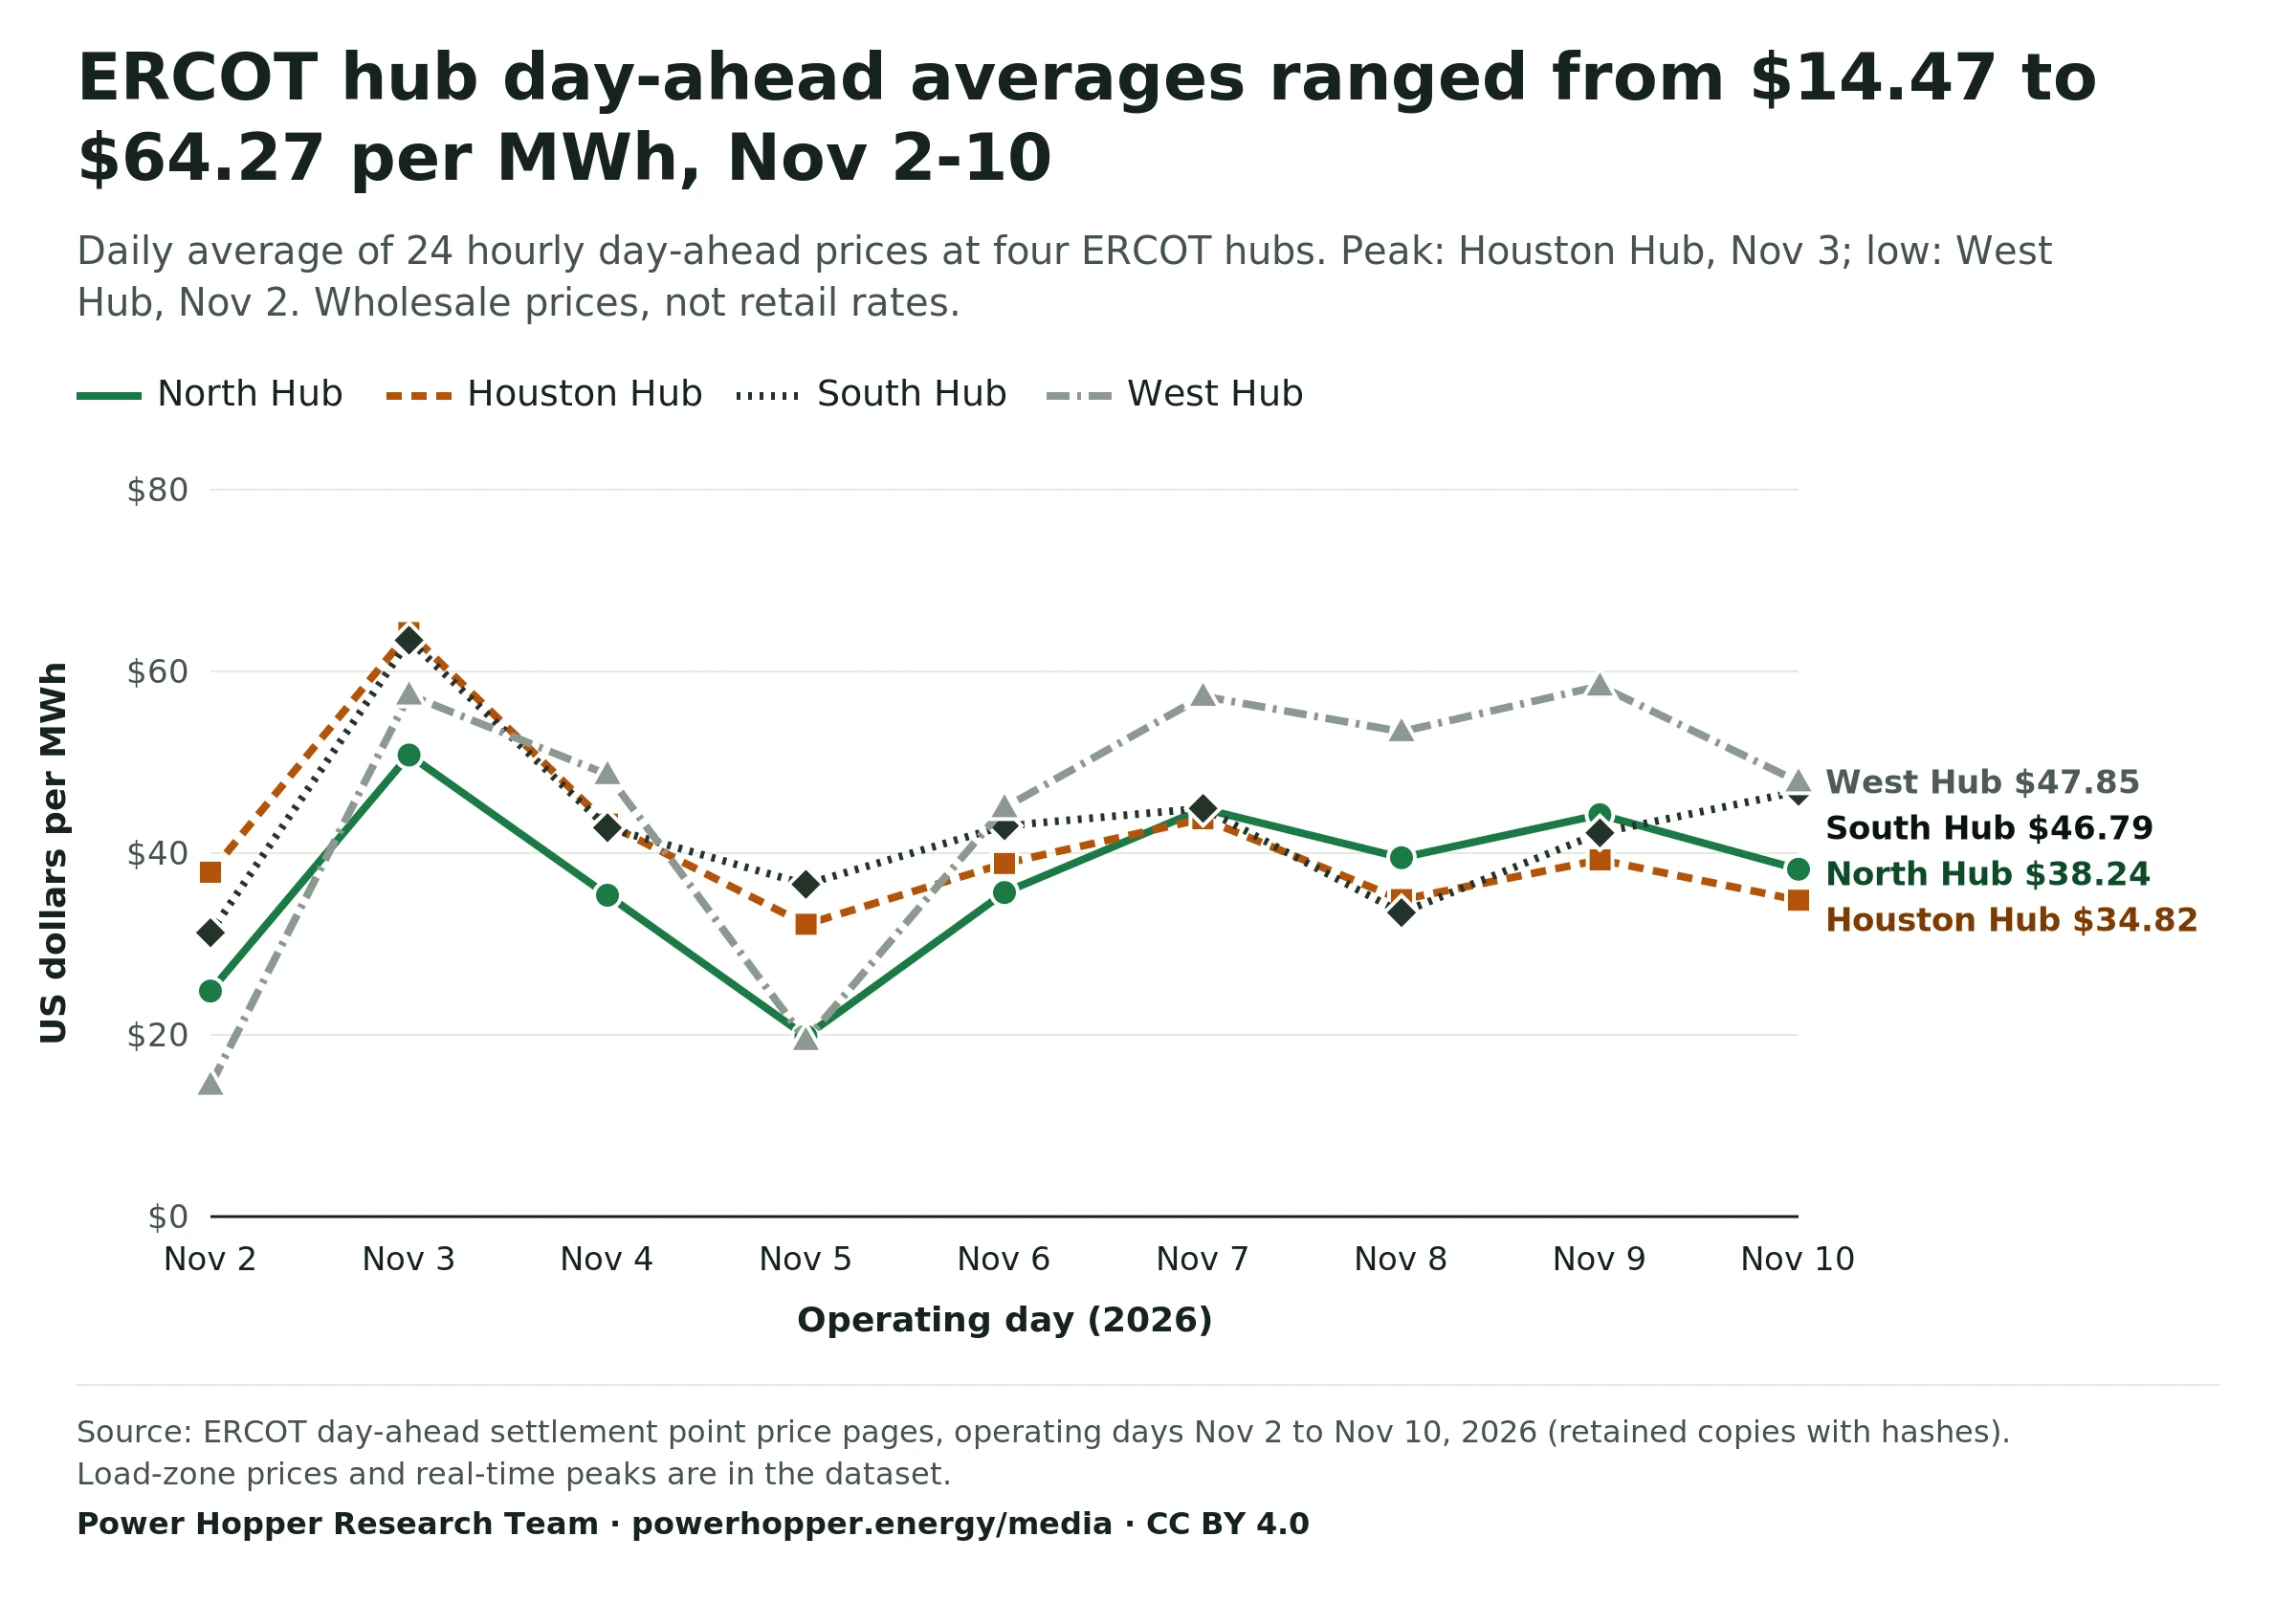
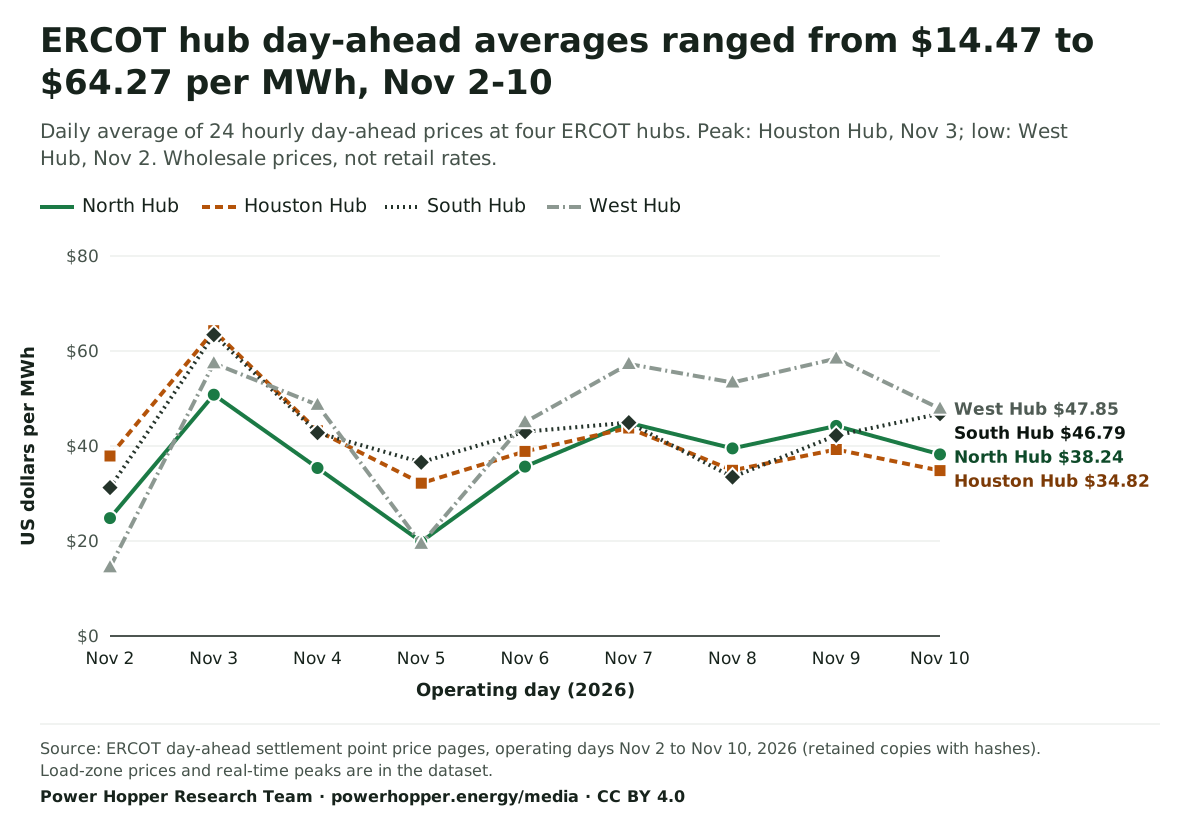
ERCOT hub day-ahead averages ranged from $14.47 to $64.27 per MWh, Nov 2-10
Daily average of 24 hourly day-ahead prices at four ERCOT hubs. Peak: Houston Hub, Nov 3; low: West Hub, Nov 2. Wholesale prices, not retail rates.
- North Hub
- Houston Hub
- South Hub
- West Hub
Source: ERCOT day-ahead settlement point price pages, operating days Nov 2 to Nov 10, 2026 (retained copies with hashes). Load-zone prices and real-time peaks are in the dataset.
Download PNG of ERCOT day-ahead daily average prices by hub, Nov 2 to Nov 10, 2026 WebP of ERCOT day-ahead daily average prices by hub, Nov 2 to Nov 10, 2026 SVG of ERCOT day-ahead daily average prices by hub, Nov 2 to Nov 10, 2026
Cite this chart
Power Hopper Research Team. "ERCOT day-ahead daily average prices by hub, Nov 2 to Nov 10, 2026." Chart. ERCOT Daily Day-Ahead Hub and Load Zone Prices, Nov 2026 dataset. Power Hopper Media Data Room, published November 10, 2026. https://powerhopper.energy/media/charts#chart-ercot-day-ahead-daily-average-hub-prices-2026-11-02-to-2026-11-10. Accessed [date accessed].
Data table
| Operating day | North Hub | Houston Hub | South Hub | West Hub |
|---|---|---|---|---|
| Nov 2 | $24.83 | $37.90 | $31.24 | $14.47 |
| Nov 3 | $50.80 | $64.27 | $63.43 | $57.41 |
| Nov 4 | $35.36 | $43.20 | $42.81 | $48.66 |
| Nov 5 | $19.86 | $32.16 | $36.56 | $19.39 |
| Nov 6 | $35.66 | $38.86 | $43.02 | $45.01 |
| Nov 7 | $44.88 | $43.79 | $44.92 | $57.27 |
| Nov 8 | $39.49 | $34.89 | $33.45 | $53.37 |
| Nov 9 | $44.23 | $39.27 | $42.23 | $58.41 |
| Nov 10 | $38.24 | $34.82 | $46.79 | $47.85 |
Utility Regulation and Legislation · Filed Nov 9, 2026; statuses as of Nov 10, 2026
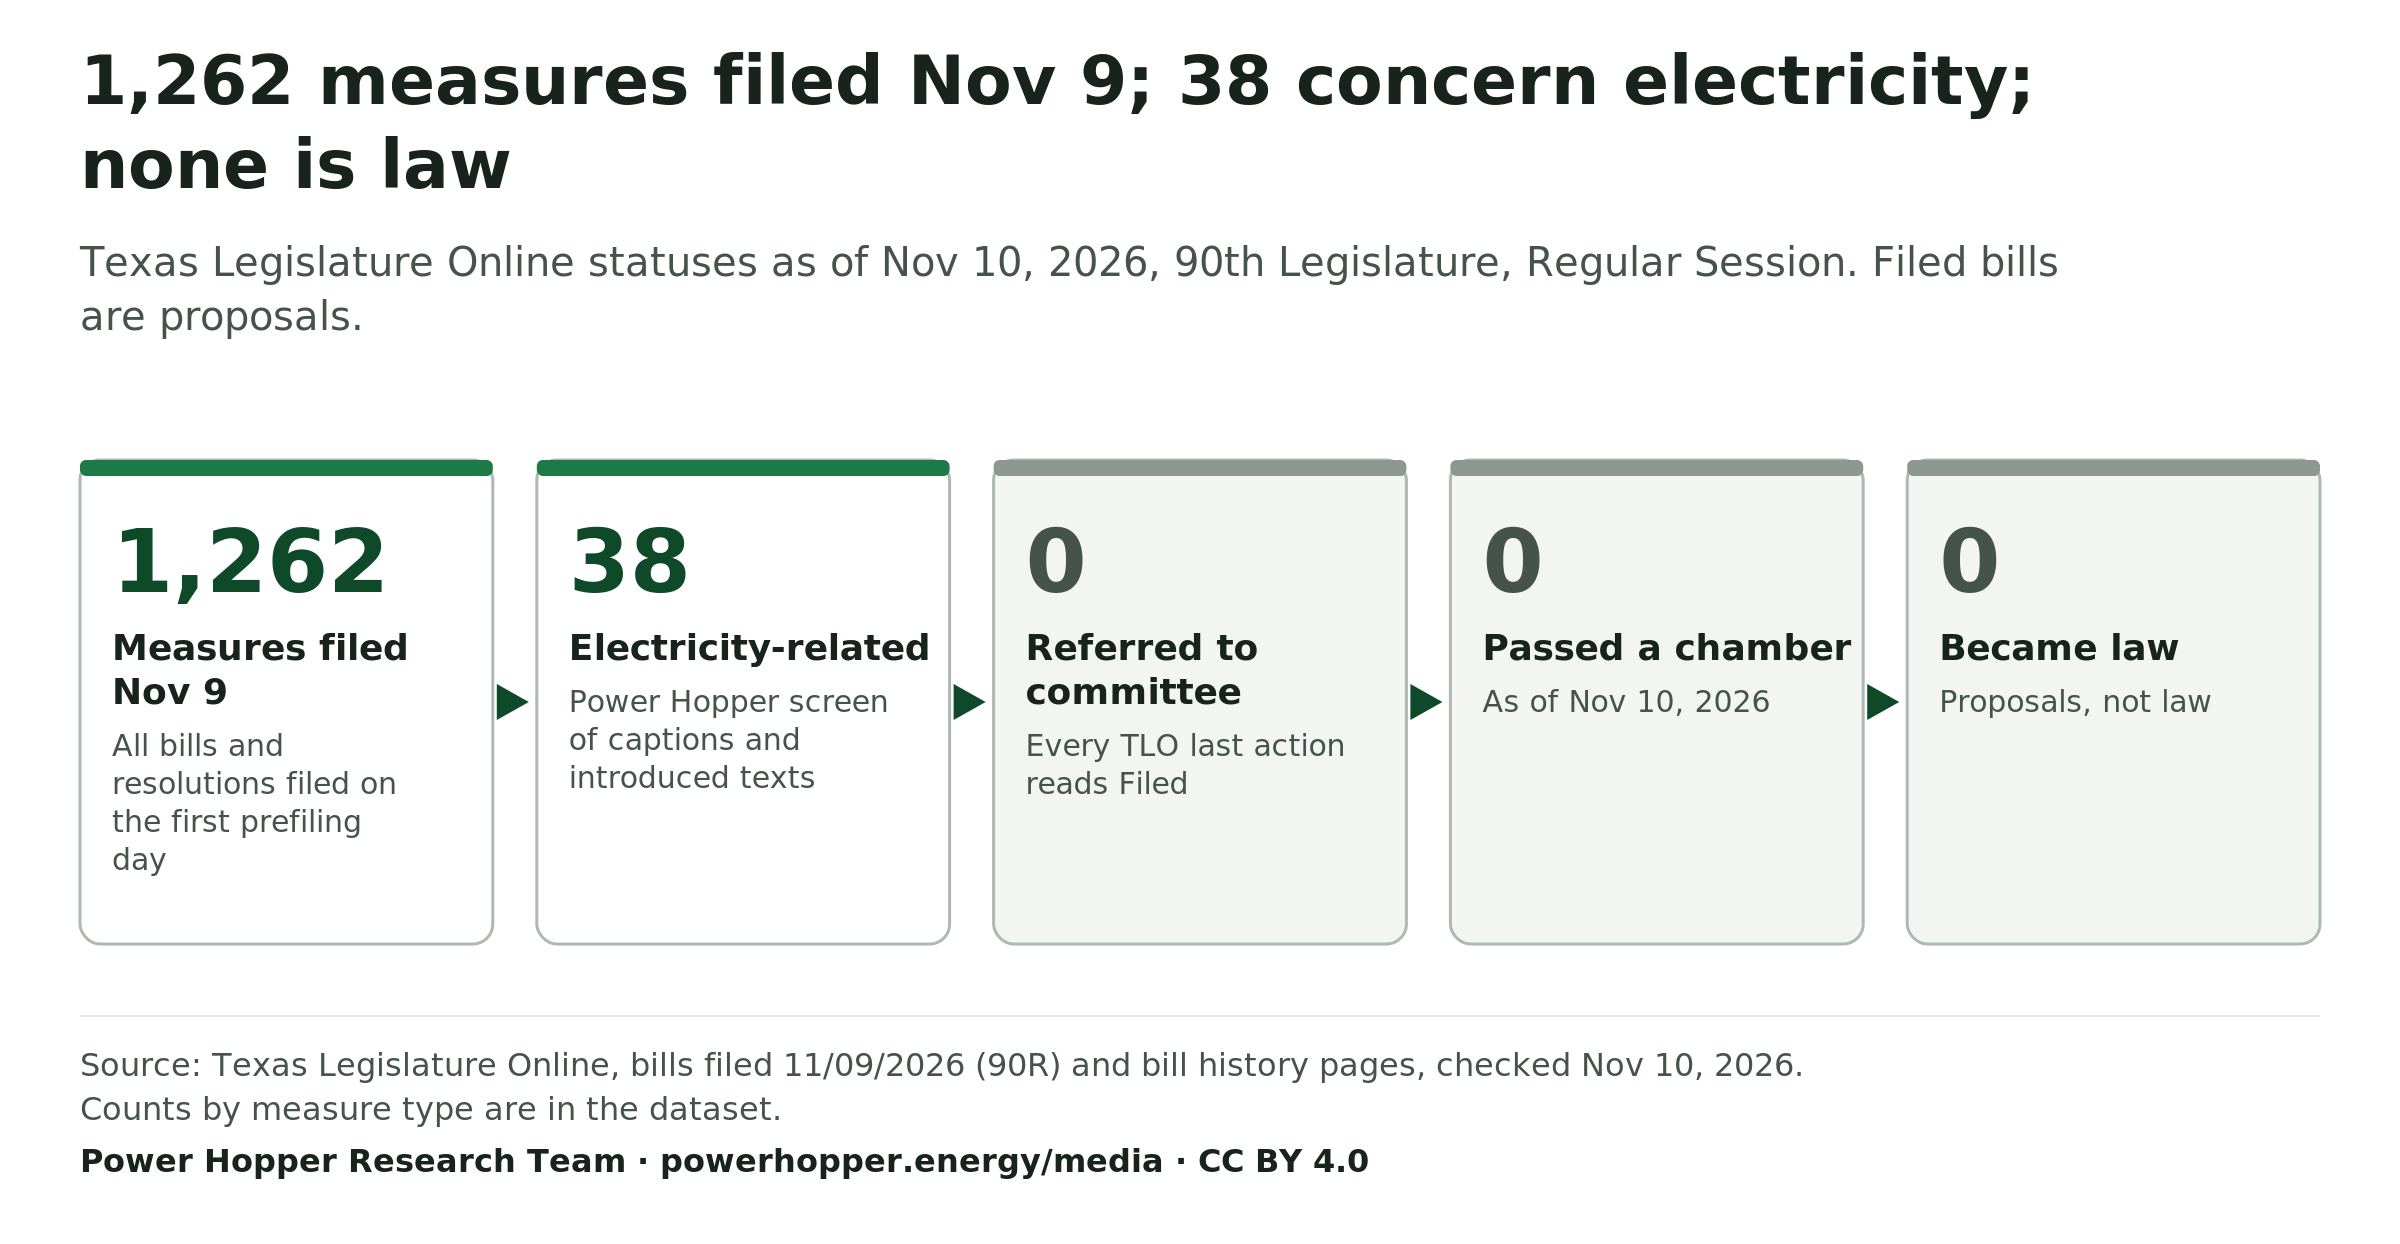
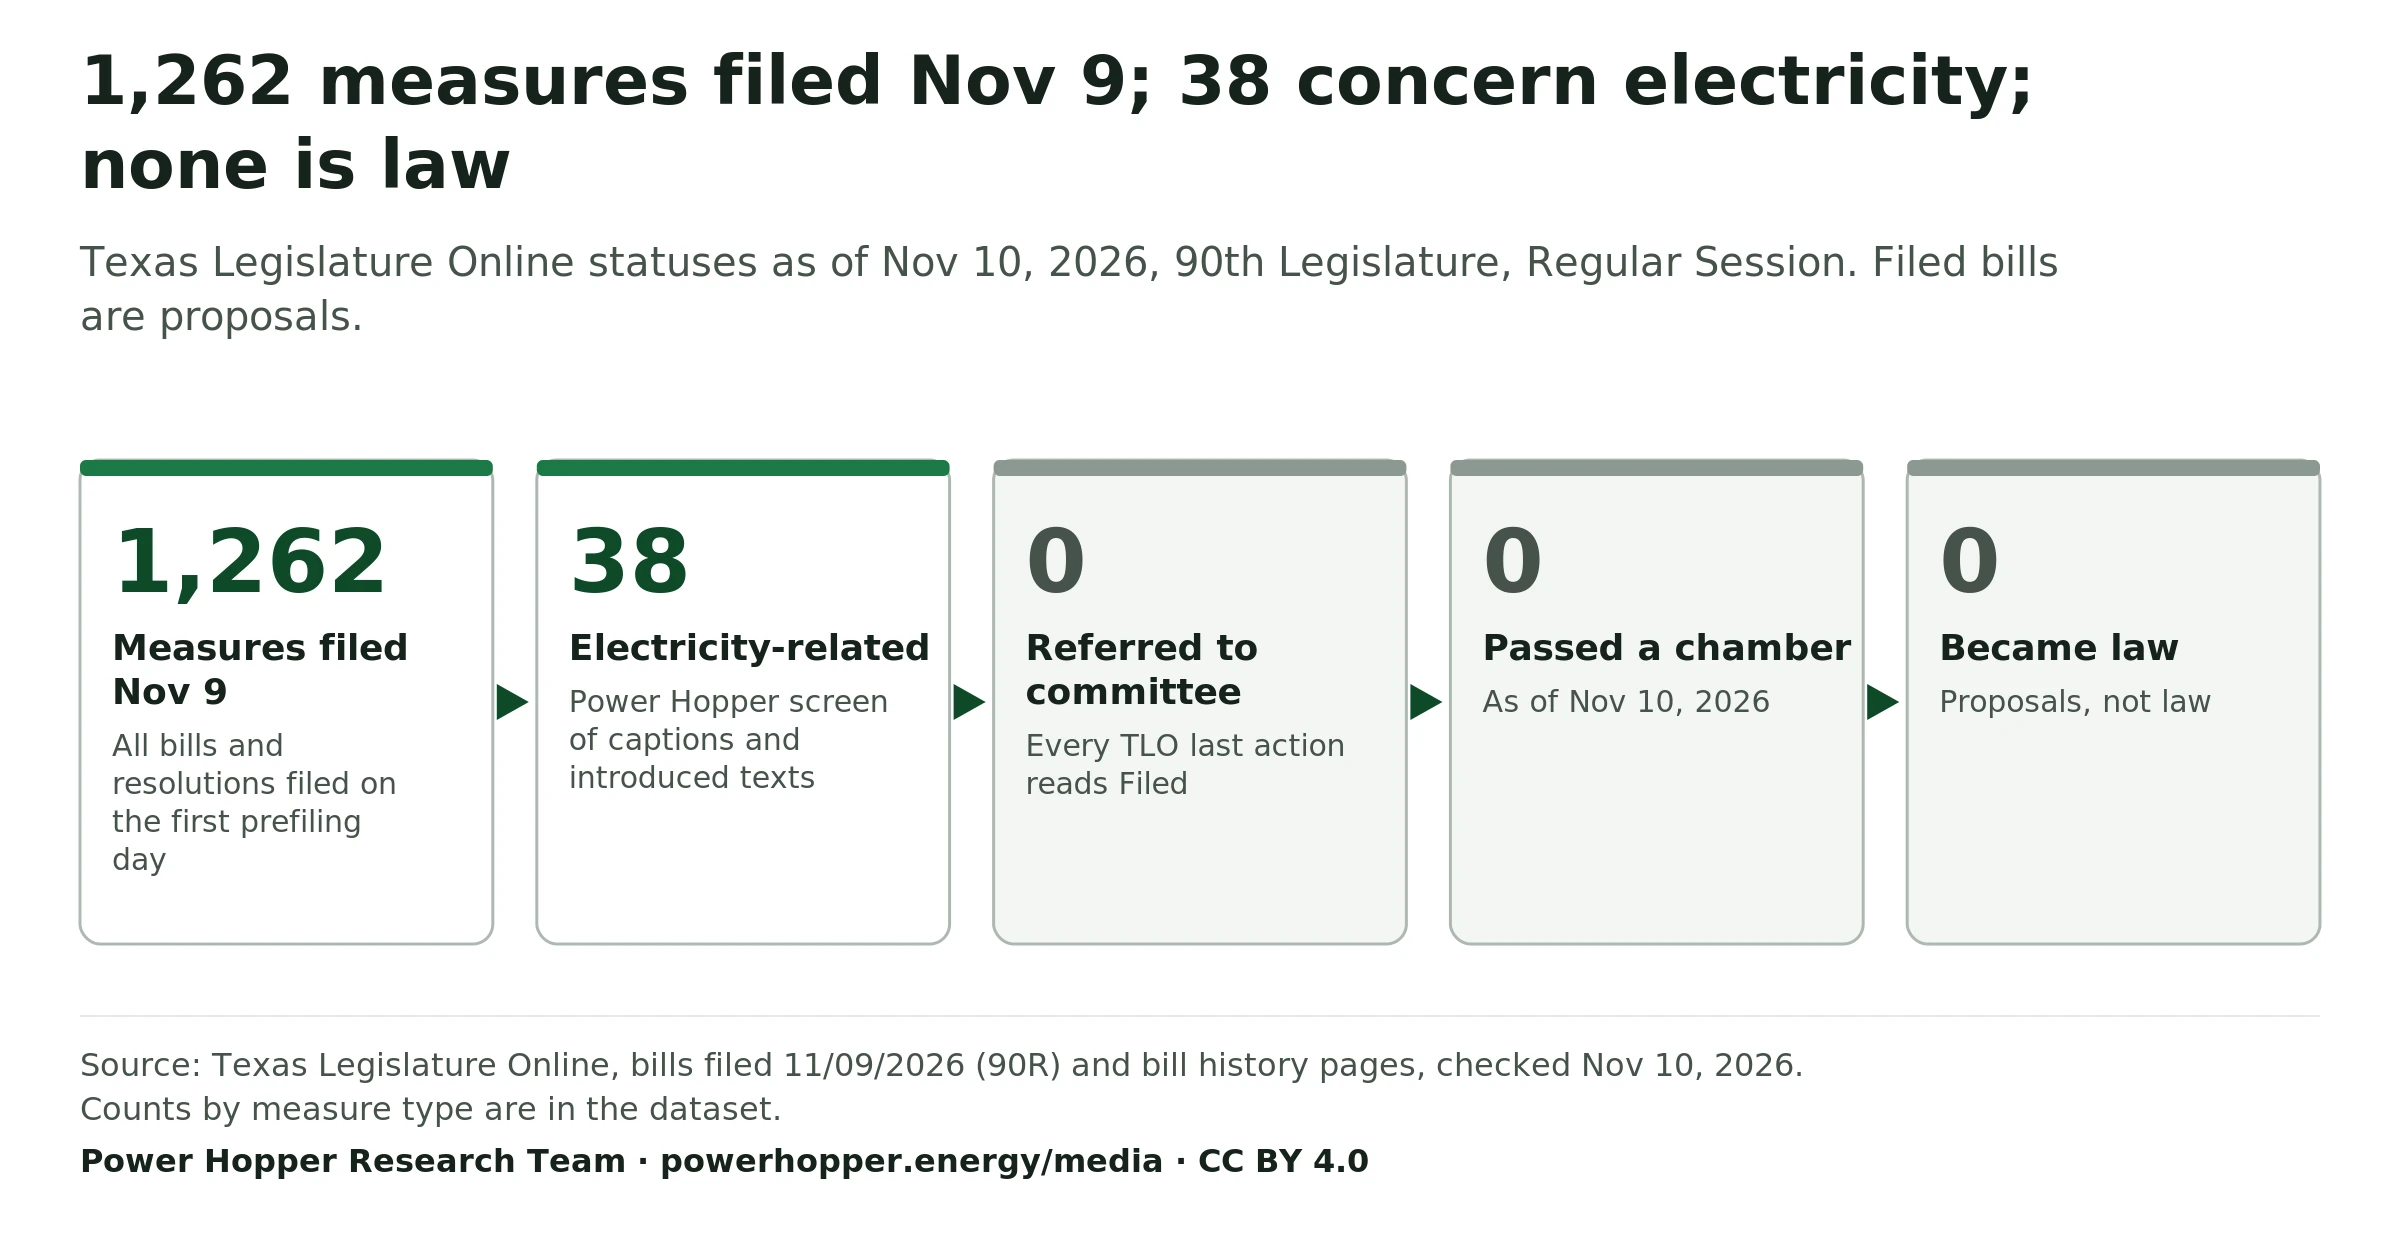
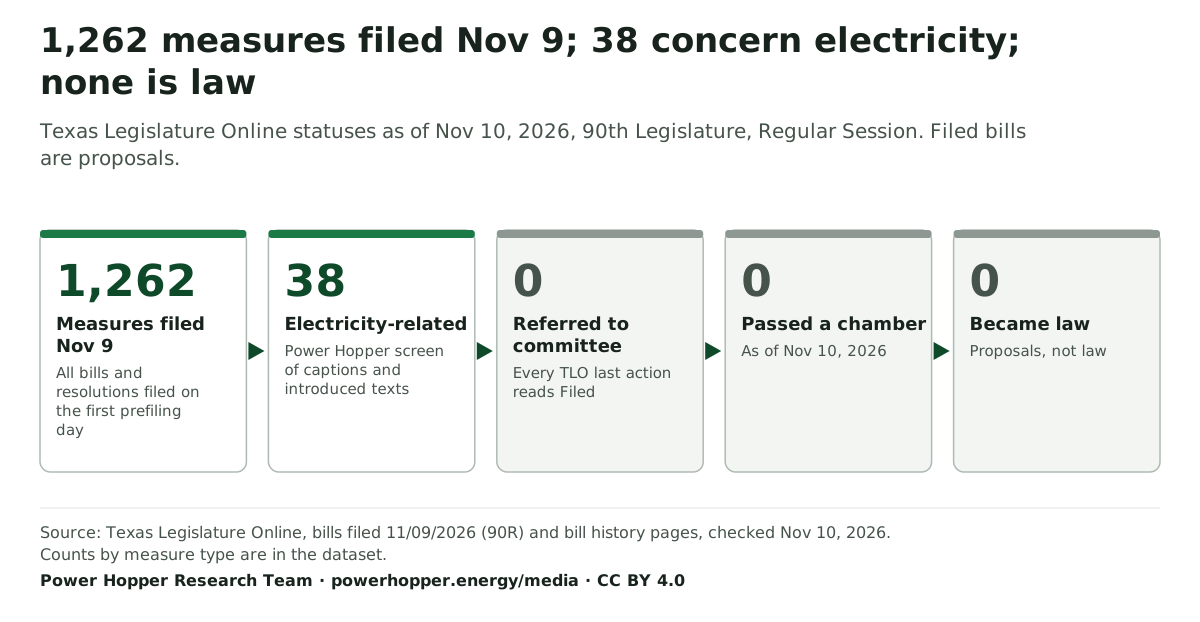
1,262 measures filed Nov 9; 38 concern electricity; none is law
Texas Legislature Online statuses as of Nov 10, 2026, 90th Legislature, Regular Session. Filed bills are proposals.
- 1,262Measures filed Nov 9All bills and resolutions filed on the first prefiling day
- 38Electricity-relatedPower Hopper screen of captions and introduced texts
- 0Referred to committeeEvery TLO last action reads Filed
- 0Passed a chamberAs of Nov 10, 2026
- 0Became lawProposals, not law
Source: Texas Legislature Online, bills filed 11/09/2026 (90R) and bill history pages, checked Nov 10, 2026. Counts by measure type are in the dataset.
Download PNG of From filed to law: status of the Nov 9, 2026 electricity bills WebP of From filed to law: status of the Nov 9, 2026 electricity bills SVG of From filed to law: status of the Nov 9, 2026 electricity bills
Cite this chart
Power Hopper Research Team. "From filed to law: status of the Nov 9, 2026 electricity bills." Chart. Texas Electricity Bills Filed Nov 9, 2026 (Pending Proposals) dataset. Power Hopper Media Data Room, published November 10, 2026. https://powerhopper.energy/media/charts#chart-texas-legislature-electricity-bills-filed-to-law-flow-2026-11-10. Accessed [date accessed].
Data table
| Step | Count | Note |
|---|---|---|
| Measures filed Nov 9 | 1,262 | All bills and resolutions filed on the first prefiling day |
| Electricity-related | 38 | Power Hopper screen of captions and introduced texts |
| Referred to committee | 0 | Every TLO last action reads Filed |
| Passed a chamber | 0 | As of Nov 10, 2026 |
| Became law | 0 | Proposals, not law |
Retail Competition · As of Nov 10, 2026
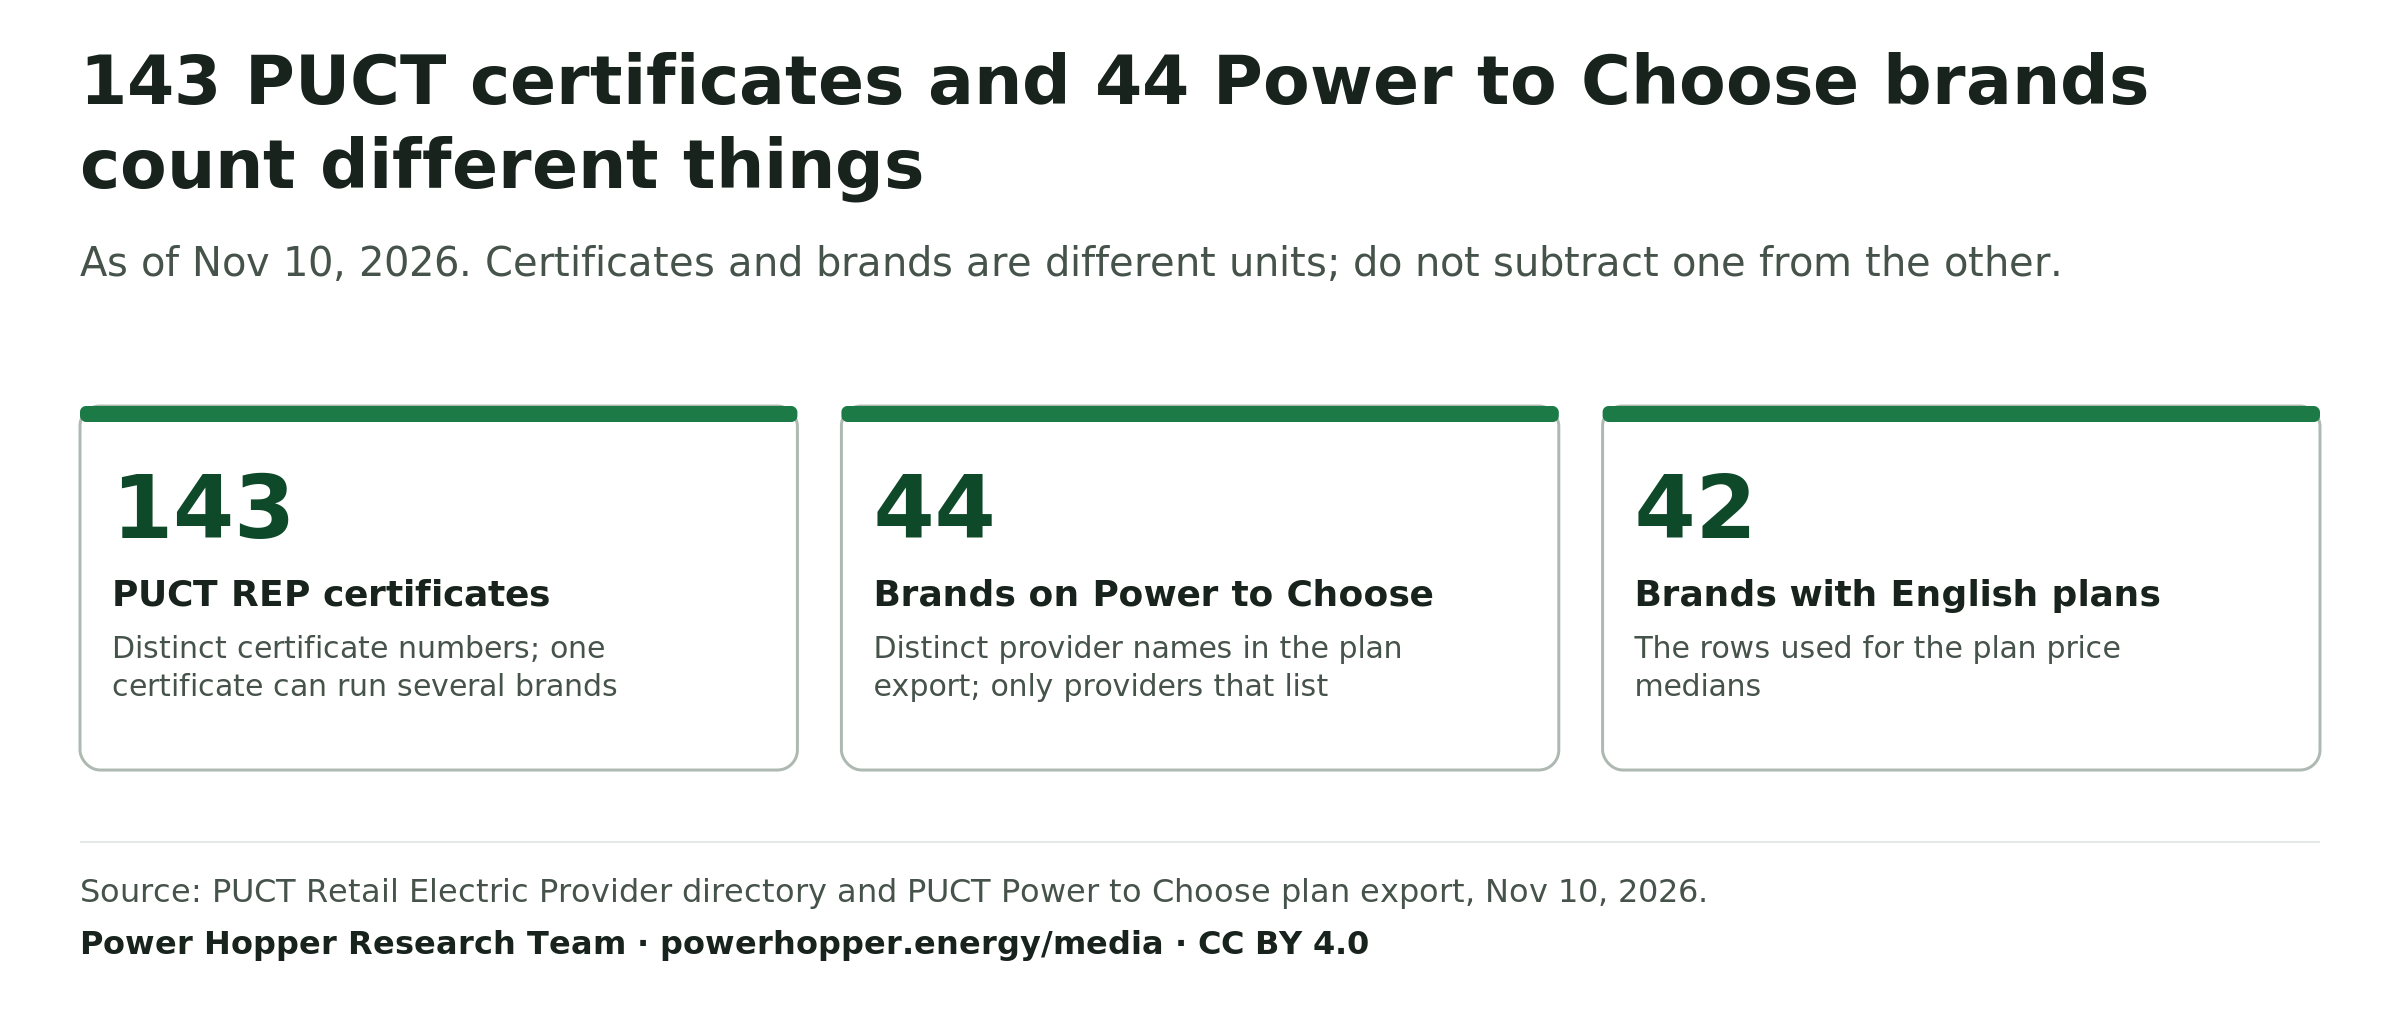
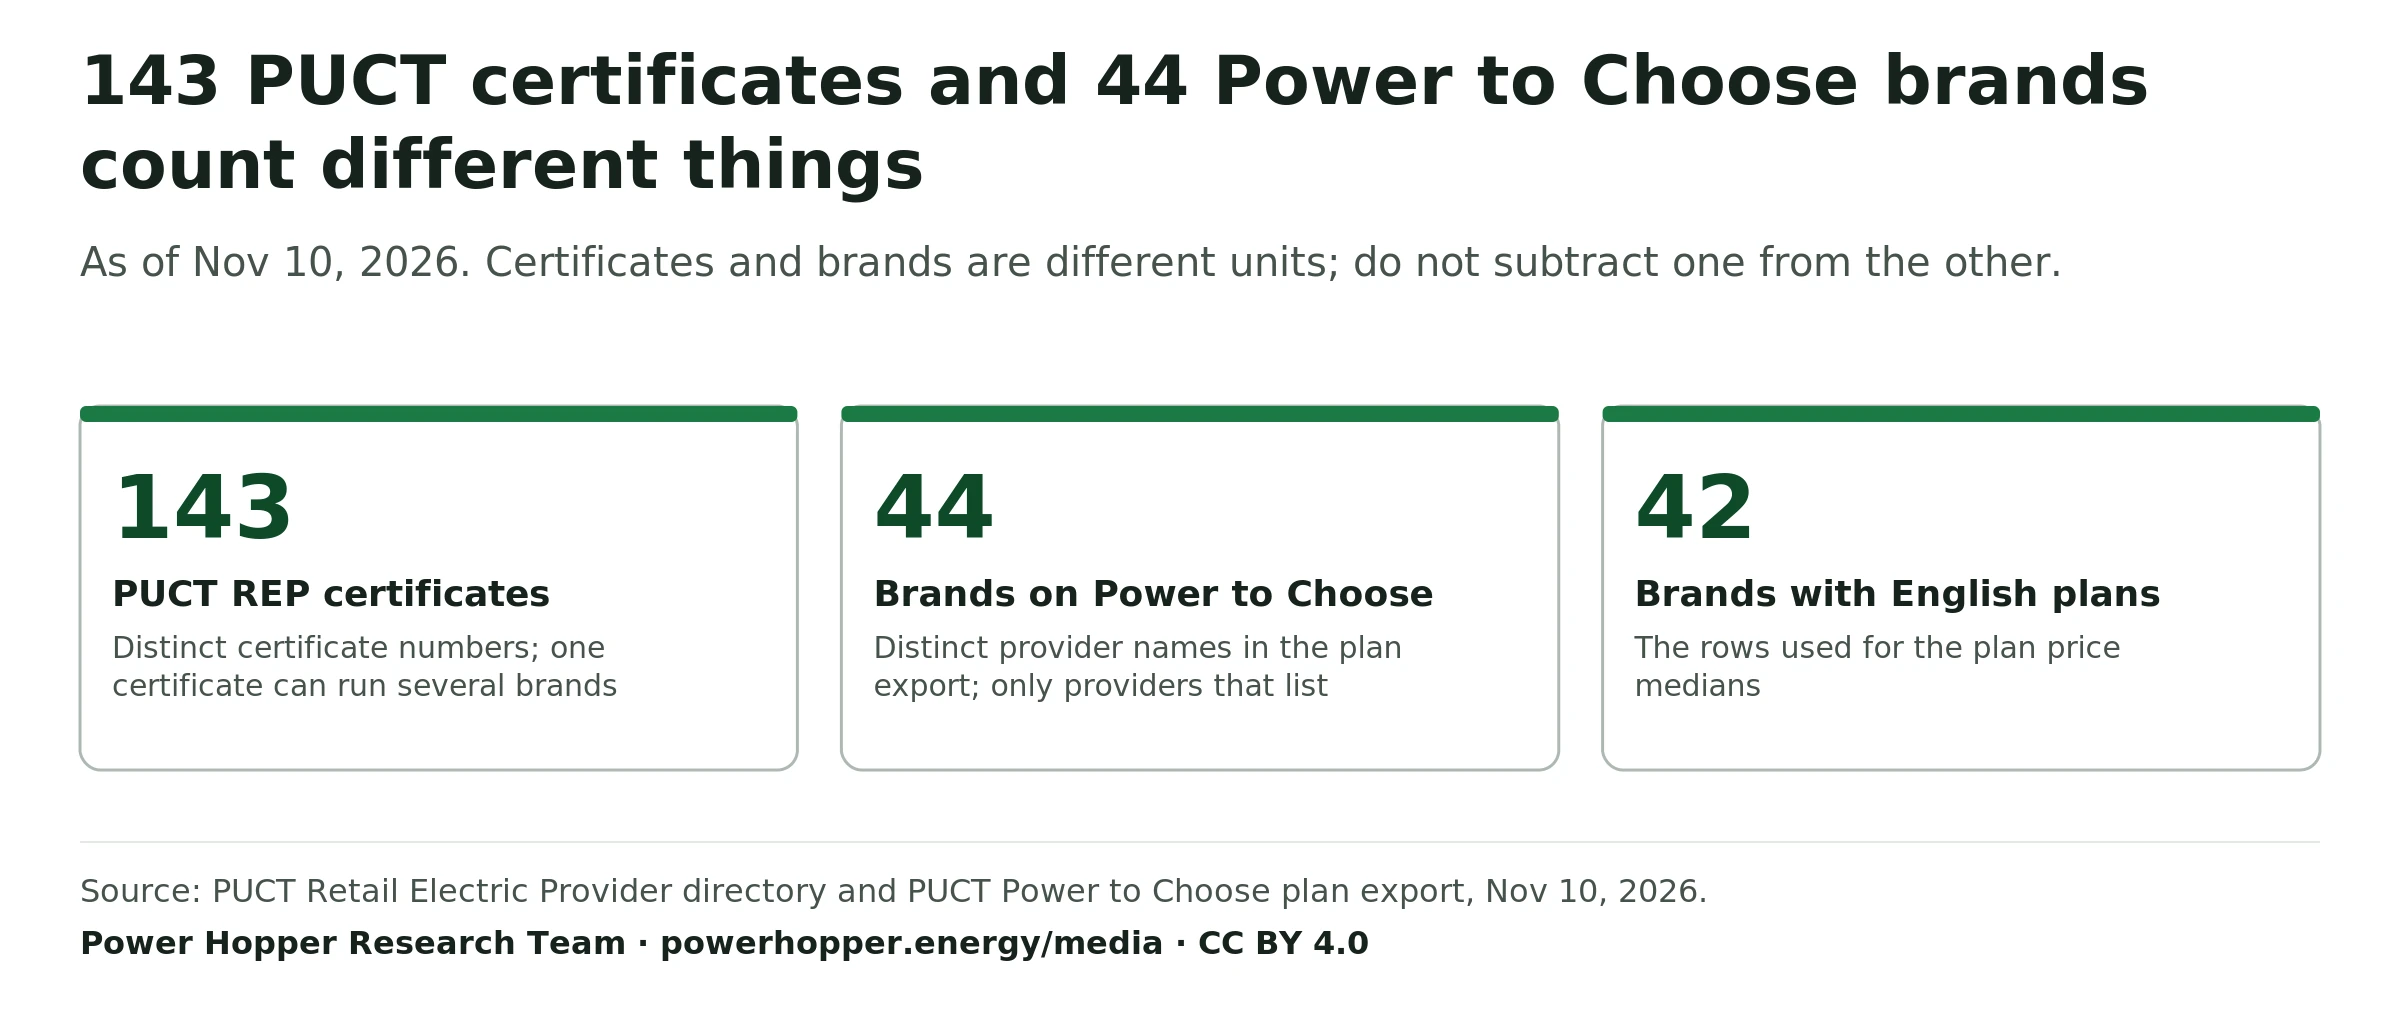
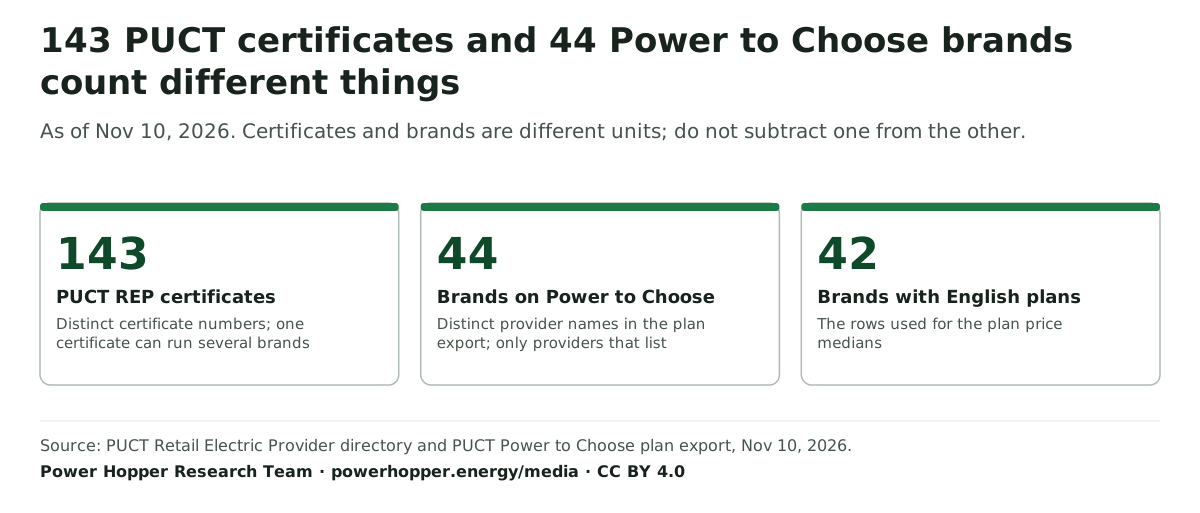
143 PUCT certificates and 44 Power to Choose brands count different things
As of Nov 10, 2026. Certificates and brands are different units; do not subtract one from the other.
- 143PUCT REP certificatesDistinct certificate numbers; one certificate can run several brands
- 44Brands on Power to ChooseDistinct provider names in the plan export; only providers that list
- 42Brands with English plansThe rows used for the plan price medians
Source: PUCT Retail Electric Provider directory and PUCT Power to Choose plan export, Nov 10, 2026.
Download PNG of Provider counts defined: PUCT certificates vs Power to Choose brands, Nov 10, 2026 WebP of Provider counts defined: PUCT certificates vs Power to Choose brands, Nov 10, 2026 SVG of Provider counts defined: PUCT certificates vs Power to Choose brands, Nov 10, 2026
Cite this chart
Power Hopper Research Team. "Provider counts defined: PUCT certificates vs Power to Choose brands, Nov 10, 2026." Chart. Texas Retail Electric Provider Counts: PUCT Certificates vs. Power to Choose Brands dataset. Power Hopper Media Data Room, published November 10, 2026. https://powerhopper.energy/media/charts#chart-texas-retail-electric-provider-count-definitions-2026-11-10. Accessed [date accessed].
Data table
| Step | Count | Note |
|---|---|---|
| PUCT REP certificates | 143 | Distinct certificate numbers; one certificate can run several brands |
| Brands on Power to Choose | 44 | Distinct provider names in the plan export; only providers that list |
| Brands with English plans | 42 | The rows used for the plan price medians |
Data quality
Data Quality · Records dated Sep 20 to Nov 2, 2026
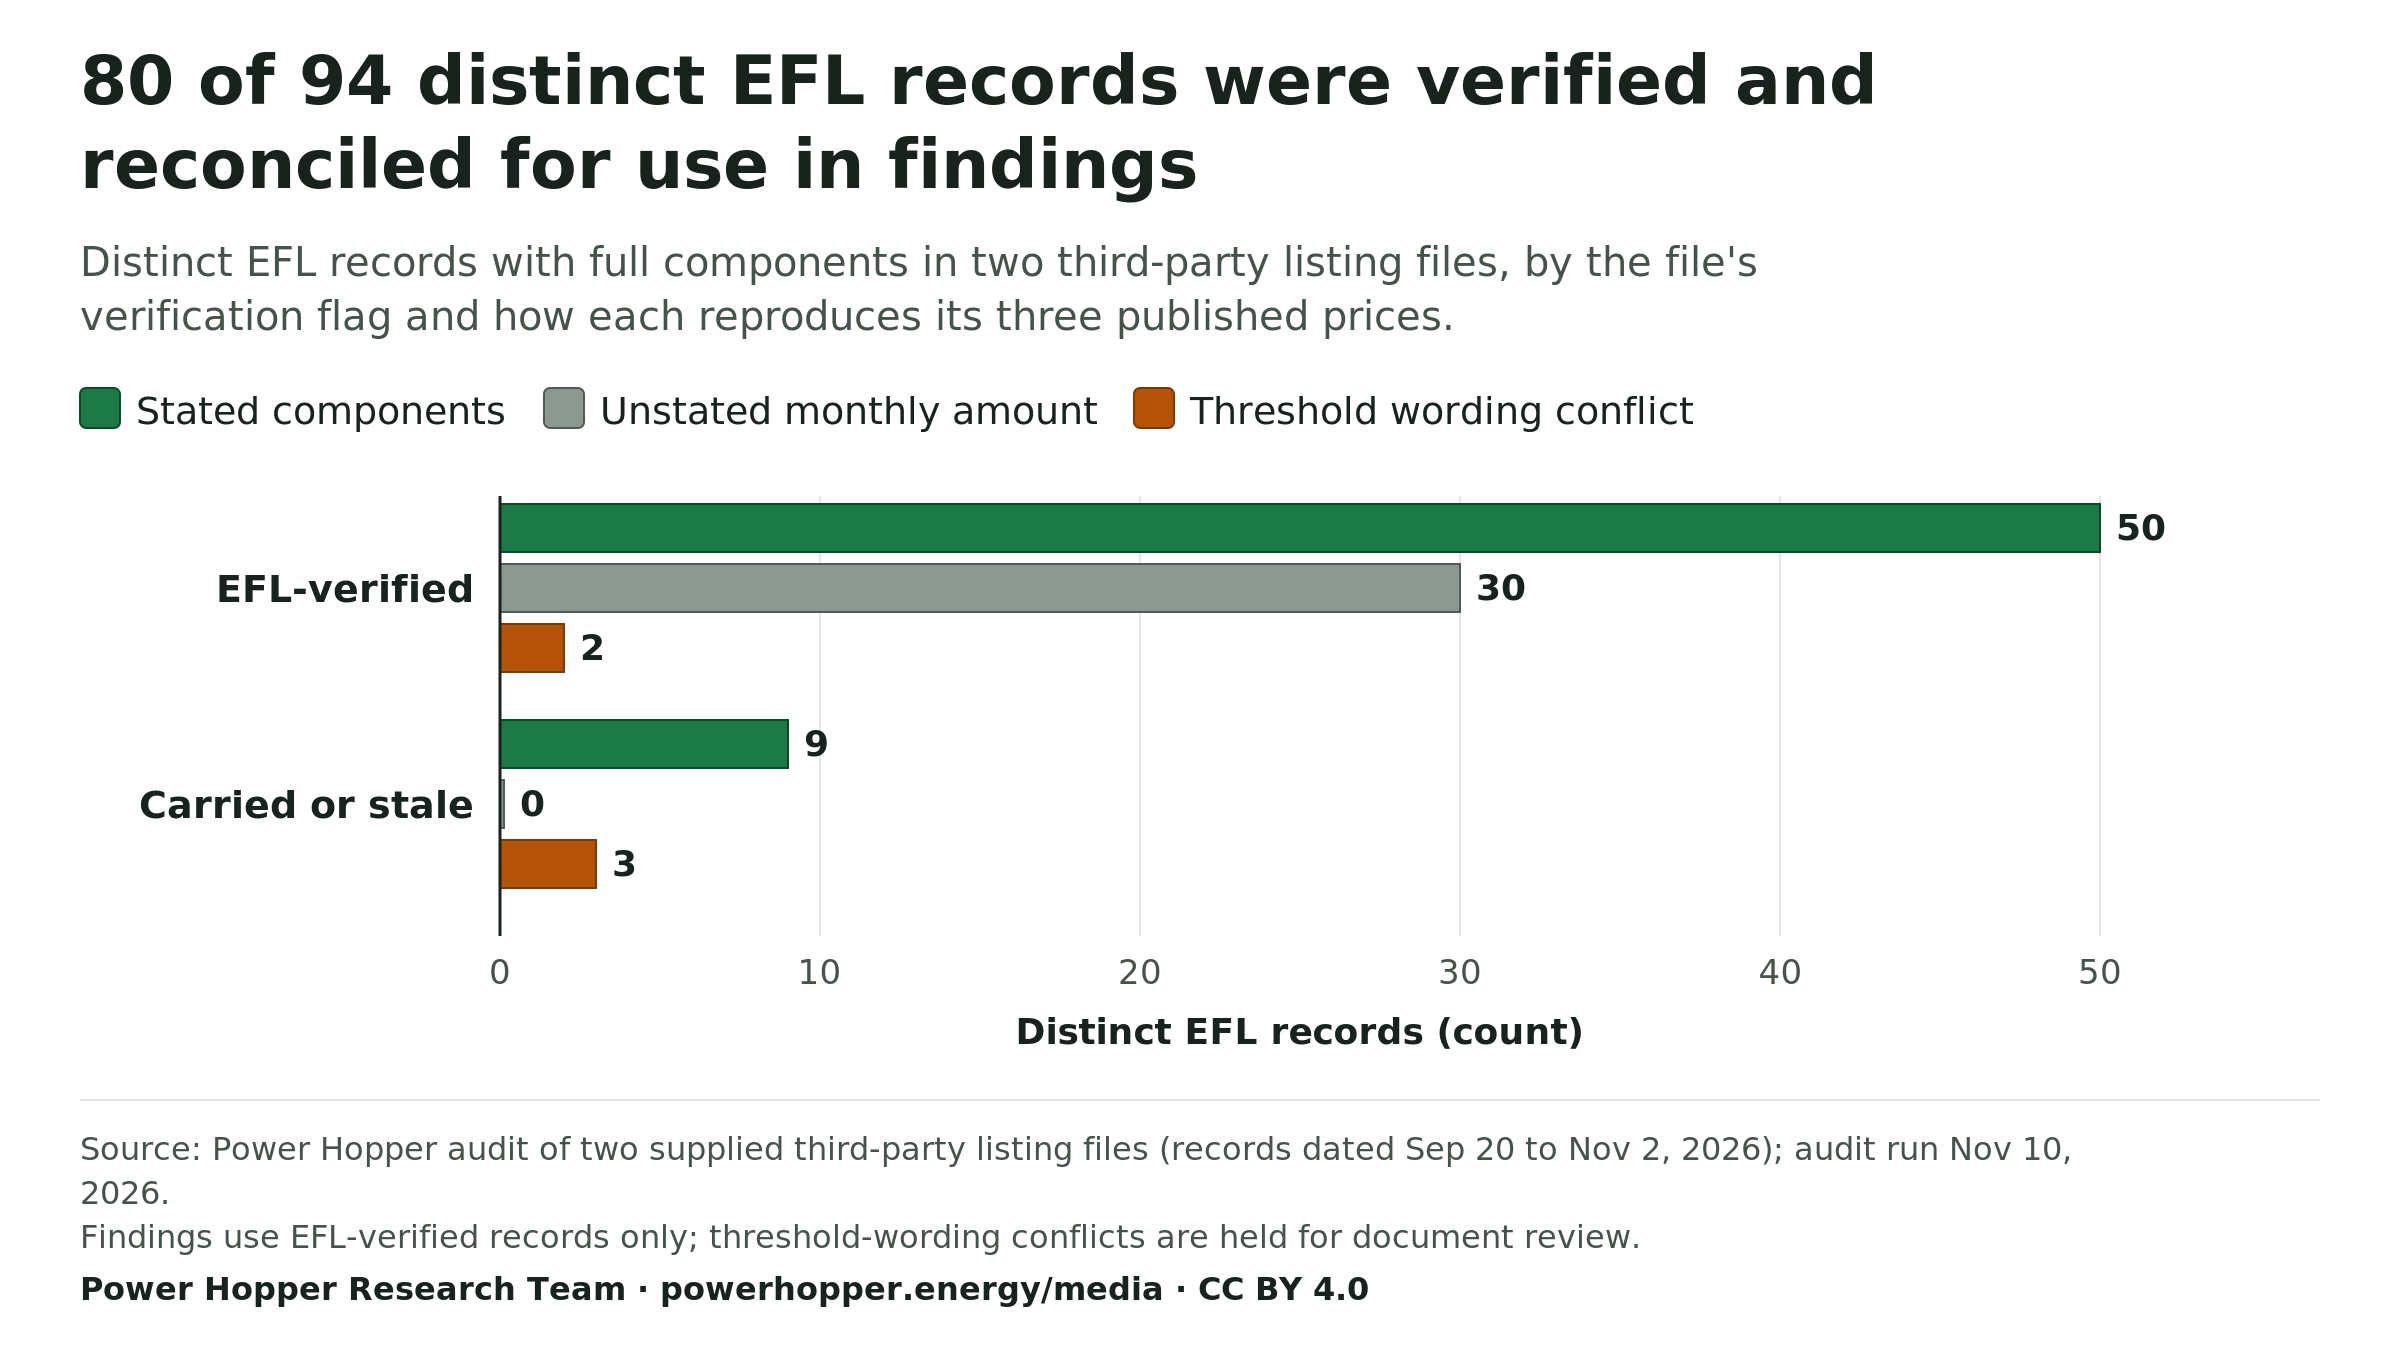
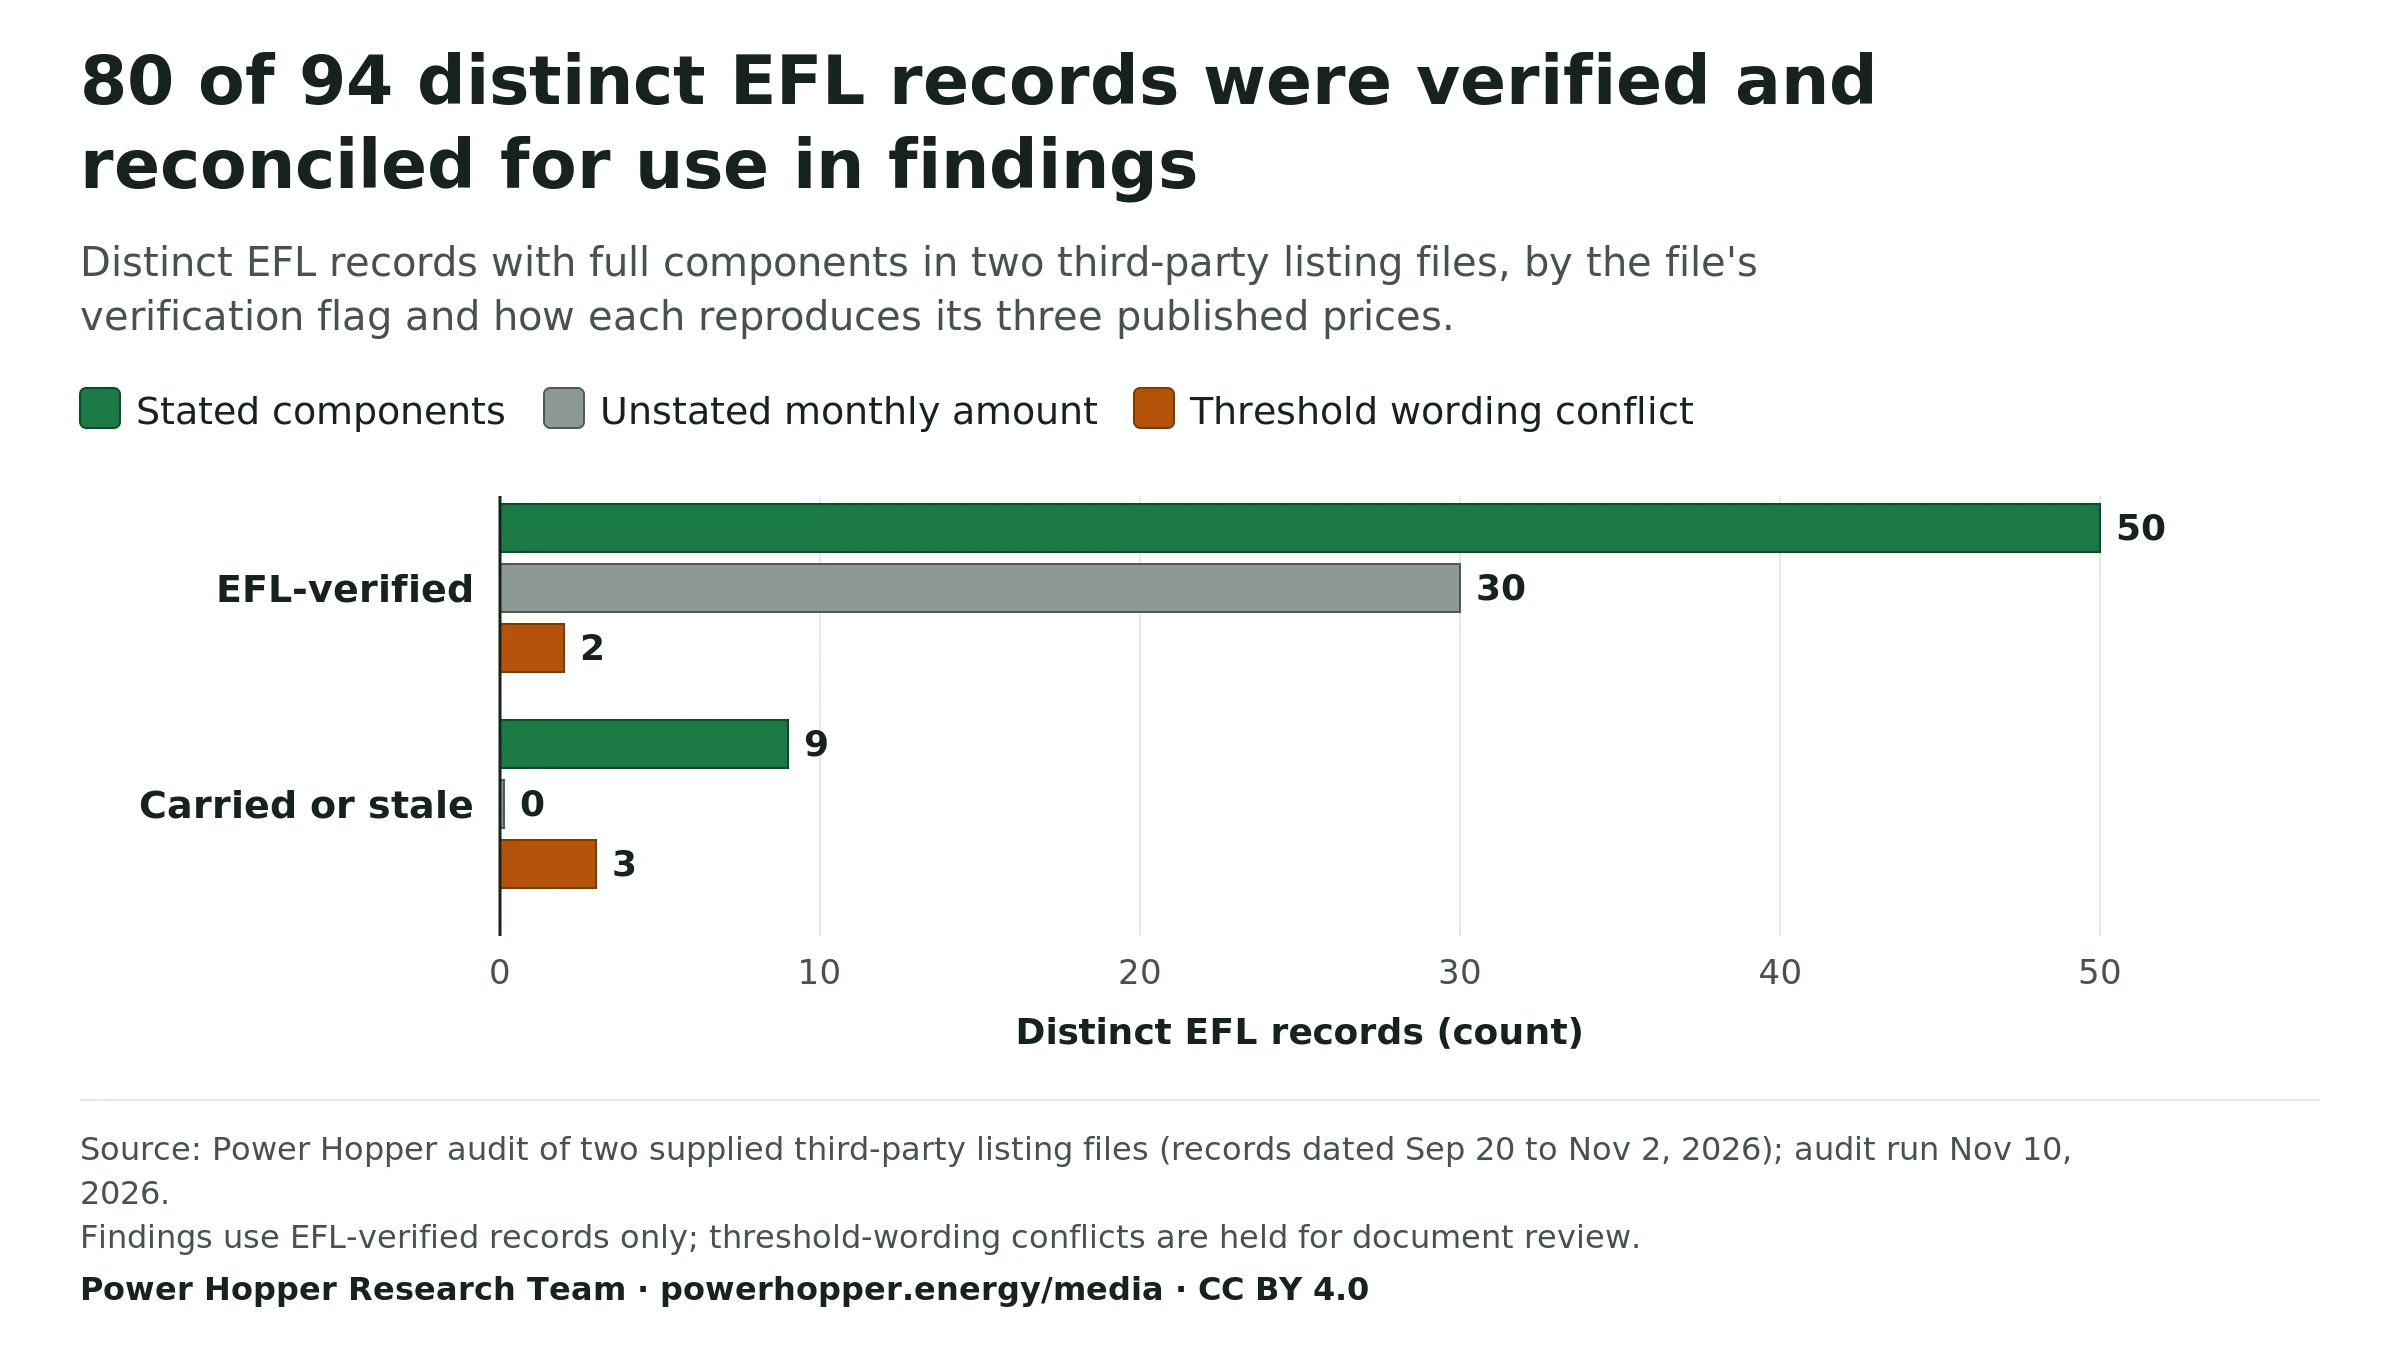
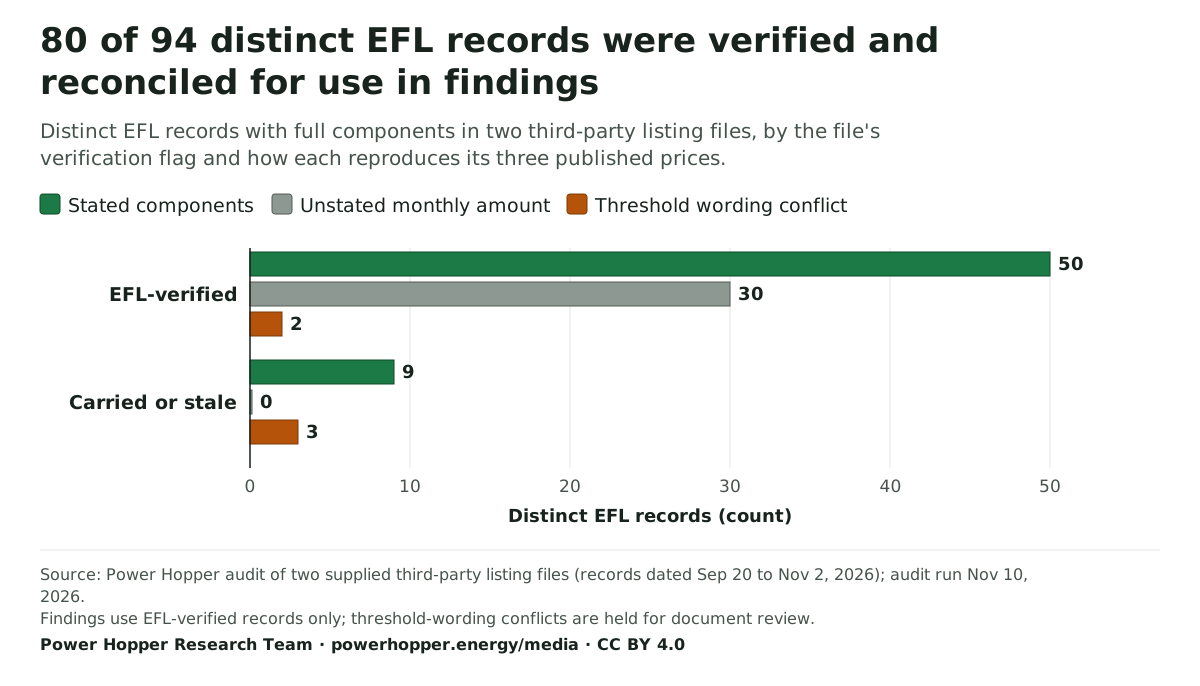
80 of 94 distinct EFL records were verified and reconciled for use in findings
Distinct EFL records with full components in two third-party listing files, by the file's verification flag and how each reproduces its three published prices.
- Stated components
- Unstated monthly amount
- Threshold wording conflict
Distinct EFL records (count)
Source: Power Hopper audit of two supplied third-party listing files (records dated Sep 20 to Nov 2, 2026); audit run Nov 10, 2026. Findings use EFL-verified records only; threshold-wording conflicts are held for document review.
Download PNG of EFL records by verification class and reconciliation outcome WebP of EFL records by verification class and reconciliation outcome SVG of EFL records by verification class and reconciliation outcome
Cite this chart
Power Hopper Research Team. "EFL records by verification class and reconciliation outcome." Chart. EFL Reconciliation Audit of Third-Party Plan Listings, Sep to Nov 2026 dataset. Power Hopper Media Data Room, published November 10, 2026. https://powerhopper.energy/media/charts#chart-efl-reconciliation-audit-distinct-records. Accessed [date accessed].
Data table
| Verification class | Stated components | Unstated monthly amount | Threshold wording conflict |
|---|---|---|---|
| EFL-verified | 50 | 30 | 2 |
| Carried or stale | 9 | 0 | 3 |
Using these charts
- Tab to any bar or point to read its exact value; open Data table for every value as text.
- Downloads: PNG (2400 px wide) and WebP for print and web, SVG for editing. The static files carry the headline, source and attribution.
- Credit: Power Hopper Research Team, powerhopper.energy. CC BY 4.0 for Power Hopper analysis; source data credited to the source.