
Wholesale Market · Verified
ERCOT Daily Day-Ahead Hub and Load Zone Prices, Nov 2026
Daily average, minimum and maximum day-ahead settlement point prices for ERCOT hubs and load zones, plus real-time daily peaks for complete operating days, computed from ERCOT's public market pages.
$38.24
North Hub day-ahead average per MWh, Nov 10
Key findings
- Across Nov 2-10, 2026, the North Hub day-ahead daily average ranged from $19.86 to $50.80 per MWh.
- On Nov 4, 2026 the West Hub day-ahead average was $48.66/MWh, against $35.36/MWh at the North Hub.
- Real time: the West Hub peaked at $189.61/MWh (interval ending 20:30) on Nov 8; on Nov 9 the West load zone had 24 fifteen-minute intervals above $100/MWh, peaking at $137.48.
Data
| Day | Hub | Avg ($/MWh) | Min | Max |
|---|---|---|---|---|
| 2026-11-02 | HB_HOUSTON | 37.90 | 23.41 | 55.14 |
| 2026-11-02 | HB_NORTH | 24.83 | 14.58 | 41.69 |
| 2026-11-02 | HB_SOUTH | 31.24 | 23.26 | 50.26 |
| 2026-11-02 | HB_WEST | 14.47 | -3.76 | 45.58 |
| 2026-11-03 | HB_HOUSTON | 64.27 | 31.70 | 153.74 |
| 2026-11-03 | HB_NORTH | 50.80 | 12.25 | 150.00 |
| 2026-11-03 | HB_SOUTH | 63.43 | 27.28 | 160.64 |
| 2026-11-03 | HB_WEST | 57.41 | -1.19 | 183.08 |
| 2026-11-04 | HB_HOUSTON | 43.20 | 21.61 | 77.35 |
| 2026-11-04 | HB_NORTH | 35.36 | 10.52 | 76.98 |
| 2026-11-04 | HB_SOUTH | 42.81 | 19.55 | 82.79 |
| 2026-11-04 | HB_WEST | 48.66 | 11.36 | 120.76 |
| 2026-11-05 | HB_HOUSTON | 32.16 | 17.67 | 49.01 |
| 2026-11-05 | HB_NORTH | 19.86 | 1.29 | 42.87 |
| 2026-11-05 | HB_SOUTH | 36.56 | 18.38 | 64.47 |
| 2026-11-05 | HB_WEST | 19.39 | -1.11 | 45.94 |
| 2026-11-06 | HB_HOUSTON | 38.86 | 21.91 | 66.03 |
| 2026-11-06 | HB_NORTH | 35.66 | 12.72 | 69.15 |
| 2026-11-06 | HB_SOUTH | 43.02 | 19.34 | 76.75 |
| 2026-11-06 | HB_WEST | 45.01 | 15.58 | 87.46 |
| 2026-11-07 | HB_HOUSTON | 43.79 | 34.51 | 61.40 |
| 2026-11-07 | HB_NORTH | 44.88 | 30.10 | 65.19 |
| 2026-11-07 | HB_SOUTH | 44.92 | 35.00 | 62.20 |
| 2026-11-07 | HB_WEST | 57.27 | 39.92 | 81.88 |
| 2026-11-08 | HB_HOUSTON | 34.89 | 28.73 | 42.74 |
| 2026-11-08 | HB_NORTH | 39.49 | 24.92 | 59.65 |
| 2026-11-08 | HB_SOUTH | 33.45 | 26.74 | 41.48 |
| 2026-11-08 | HB_WEST | 53.37 | 37.33 | 75.98 |
| 2026-11-09 | HB_HOUSTON | 39.27 | 30.09 | 49.73 |
| 2026-11-09 | HB_NORTH | 44.23 | 30.10 | 66.06 |
| 2026-11-09 | HB_SOUTH | 42.23 | 32.28 | 57.32 |
| 2026-11-09 | HB_WEST | 58.41 | 39.61 | 80.89 |
| 2026-11-10 | HB_HOUSTON | 34.82 | 24.34 | 52.08 |
| 2026-11-10 | HB_NORTH | 38.24 | 24.18 | 71.59 |
| 2026-11-10 | HB_SOUTH | 46.79 | 35.06 | 76.06 |
| 2026-11-10 | HB_WEST | 47.85 | 26.87 | 86.44 |
| Day | Point | RT max ($/MWh) | Interval ending | Intervals above $100 |
|---|---|---|---|---|
| 2026-11-04 | HB_WEST | 74.04 | 0130 | 0 |
| 2026-11-04 | HB_NORTH | 55.11 | 1745 | 0 |
| 2026-11-04 | HB_HOUSTON | 52.96 | 1745 | 0 |
| 2026-11-04 | HB_SOUTH | 56.71 | 1745 | 0 |
| 2026-11-04 | LZ_WEST | 97.90 | 0145 | 0 |
| 2026-11-08 | HB_WEST | 189.61 | 2030 | 21 |
| 2026-11-08 | HB_NORTH | 156.57 | 2030 | 16 |
| 2026-11-08 | HB_HOUSTON | 57.92 | 1130 | 0 |
| 2026-11-08 | HB_SOUTH | 55.53 | 1130 | 0 |
| 2026-11-08 | LZ_WEST | 184.56 | 2030 | 22 |
| 2026-11-09 | HB_WEST | 86.00 | 2045 | 0 |
| 2026-11-09 | HB_NORTH | 57.80 | 0315 | 0 |
| 2026-11-09 | HB_HOUSTON | 55.47 | 2130 | 0 |
| 2026-11-09 | HB_SOUTH | 65.38 | 2115 | 0 |
| 2026-11-09 | LZ_WEST | 137.48 | 2045 | 24 |
Chart
Wholesale Market · Operating days Nov 2, 2026 to Nov 10, 2026
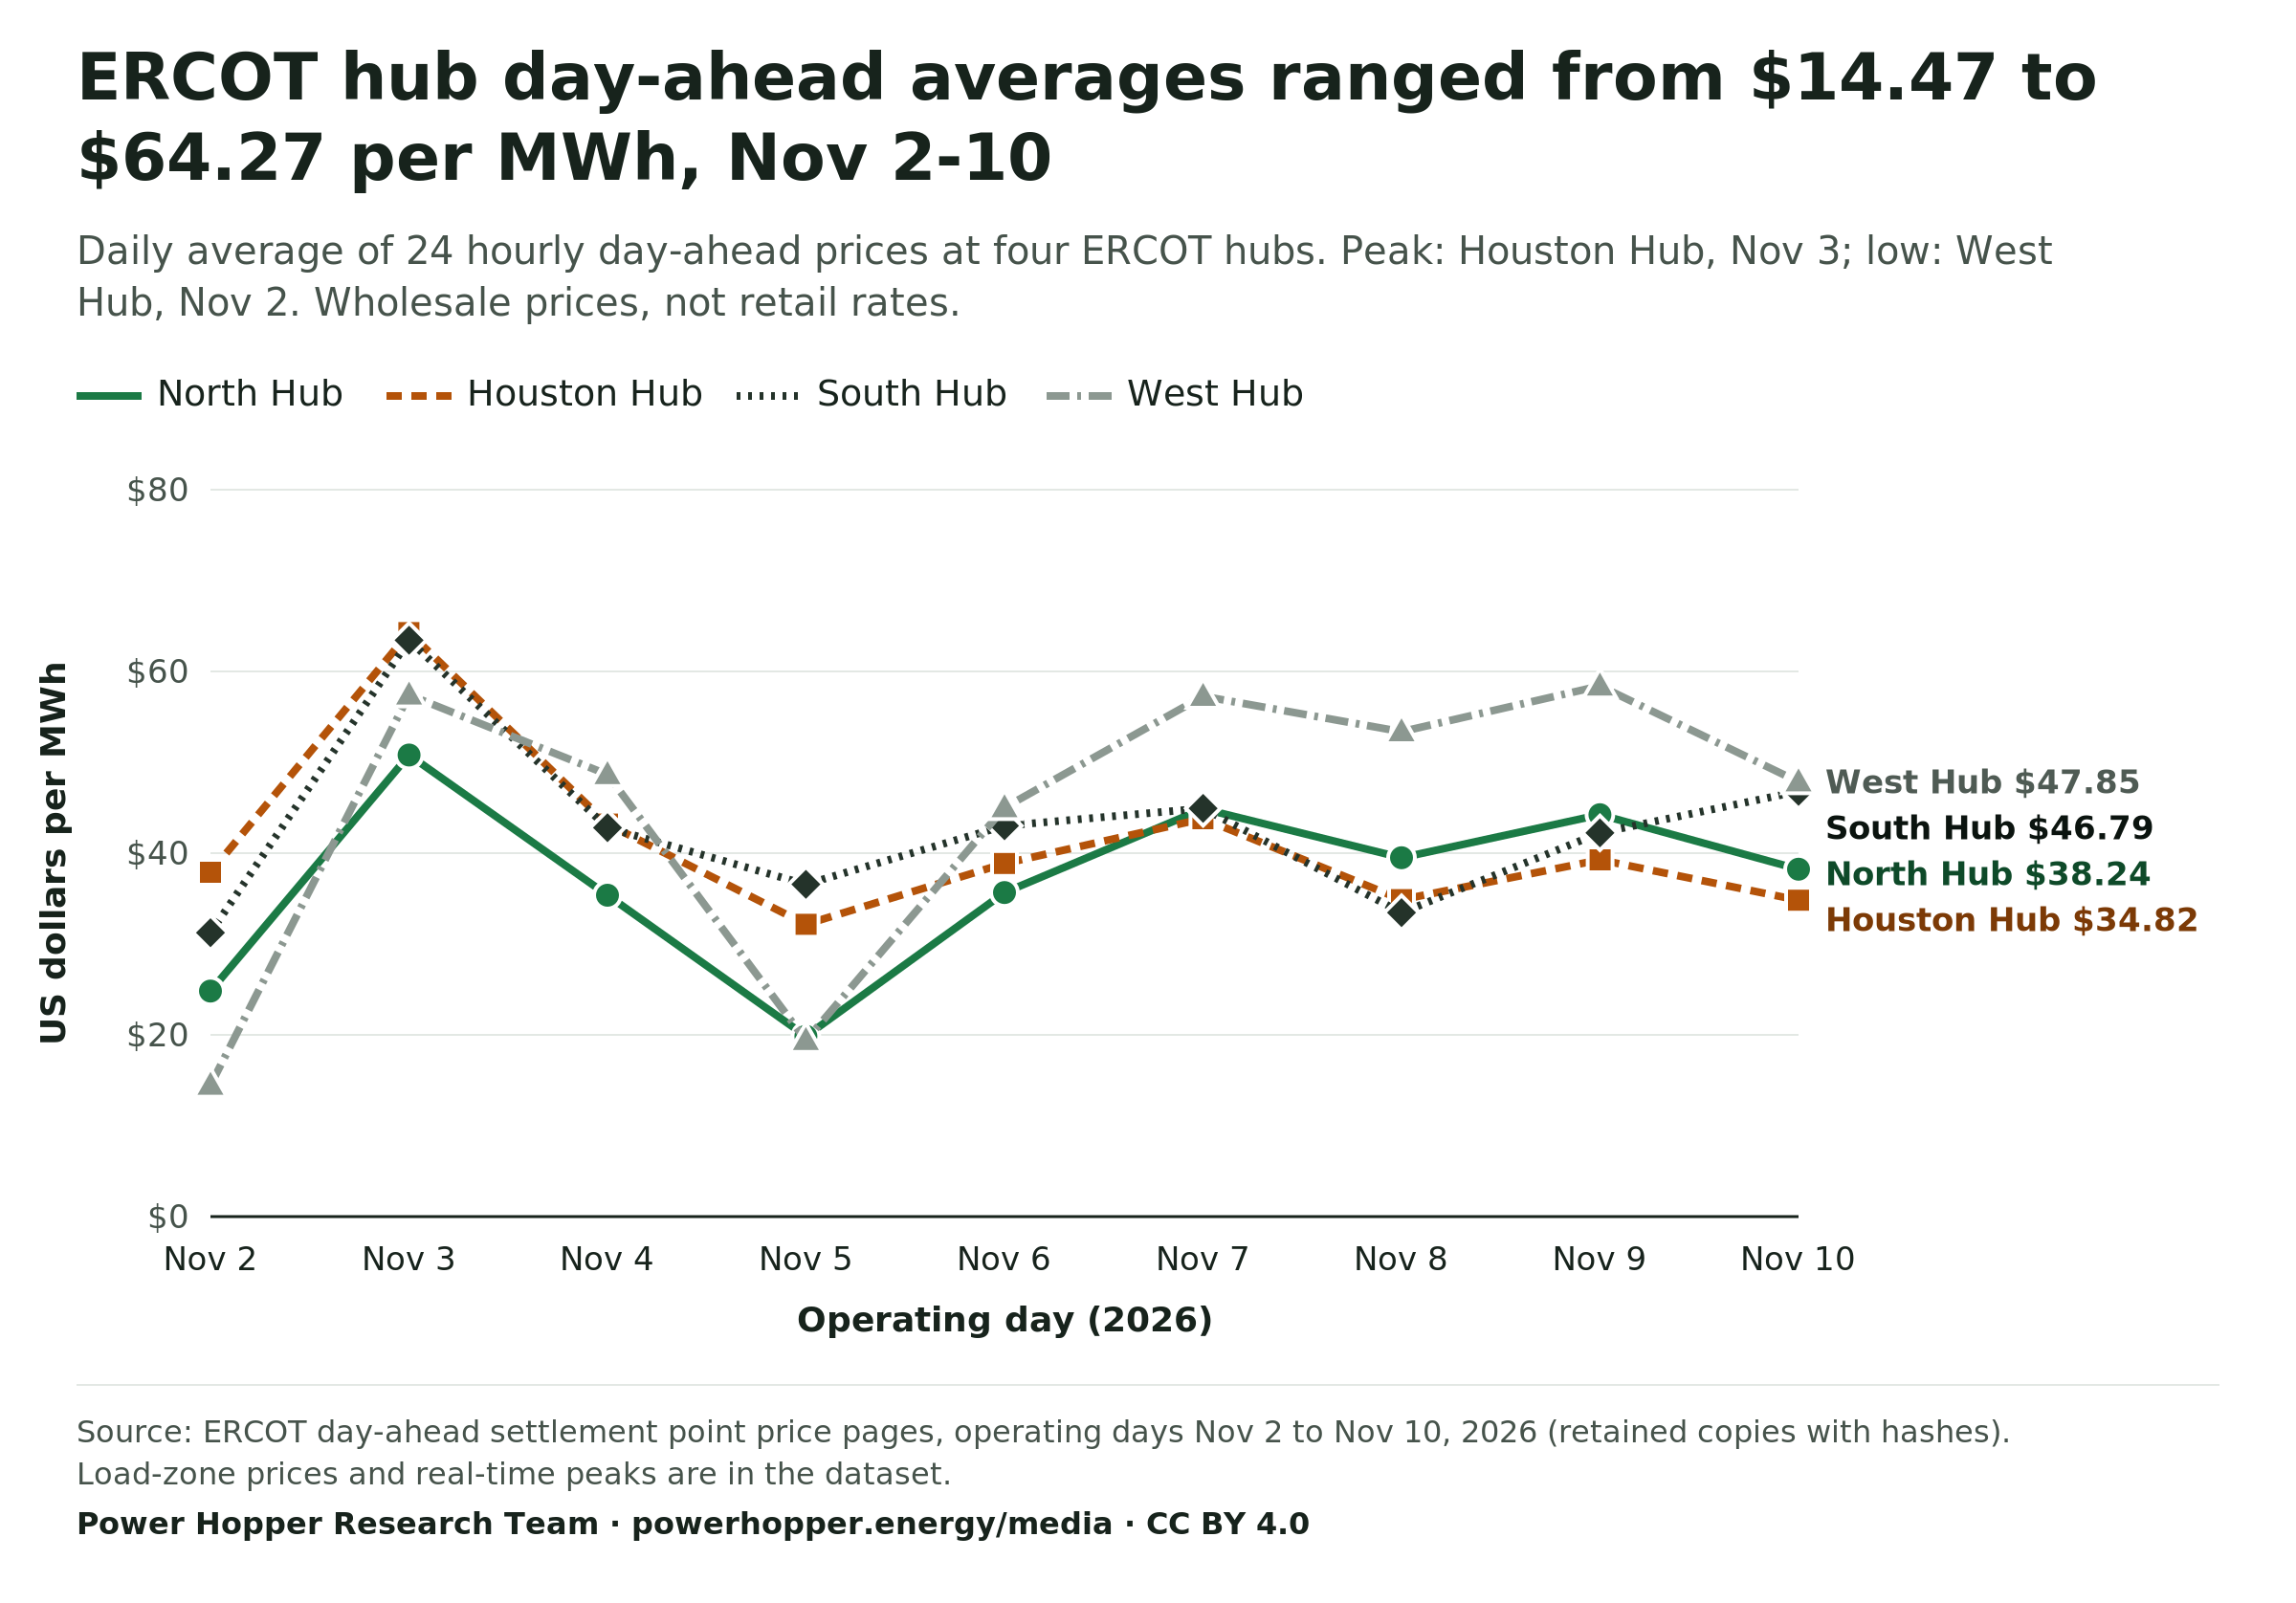
ERCOT hub day-ahead averages ranged from $14.47 to $64.27 per MWh, Nov 2-10
Daily average of 24 hourly day-ahead prices at four ERCOT hubs. Peak: Houston Hub, Nov 3; low: West Hub, Nov 2. Wholesale prices, not retail rates.
- North Hub
- Houston Hub
- South Hub
- West Hub
Source: ERCOT day-ahead settlement point price pages, operating days Nov 2 to Nov 10, 2026 (retained copies with hashes). Load-zone prices and real-time peaks are in the dataset.
Download PNG of ERCOT day-ahead daily average prices by hub, Nov 2 to Nov 10, 2026 WebP of ERCOT day-ahead daily average prices by hub, Nov 2 to Nov 10, 2026 SVG of ERCOT day-ahead daily average prices by hub, Nov 2 to Nov 10, 2026
Cite this chart
Power Hopper Research Team. "ERCOT day-ahead daily average prices by hub, Nov 2 to Nov 10, 2026." Chart. ERCOT Daily Day-Ahead Hub and Load Zone Prices, Nov 2026 dataset. Power Hopper Media Data Room, published November 10, 2026. https://powerhopper.energy/media/charts#chart-ercot-day-ahead-daily-average-hub-prices-2026-11-02-to-2026-11-10. Accessed [date accessed].
Data table
| Operating day | North Hub | Houston Hub | South Hub | West Hub |
|---|---|---|---|---|
| Nov 2 | $24.83 | $37.90 | $31.24 | $14.47 |
| Nov 3 | $50.80 | $64.27 | $63.43 | $57.41 |
| Nov 4 | $35.36 | $43.20 | $42.81 | $48.66 |
| Nov 5 | $19.86 | $32.16 | $36.56 | $19.39 |
| Nov 6 | $35.66 | $38.86 | $43.02 | $45.01 |
| Nov 7 | $44.88 | $43.79 | $44.92 | $57.27 |
| Nov 8 | $39.49 | $34.89 | $33.45 | $53.37 |
| Nov 9 | $44.23 | $39.27 | $42.23 | $58.41 |
| Nov 10 | $38.24 | $34.82 | $46.79 | $47.85 |
Methodology
- Each ERCOT daily page is saved with its SHA-256 hash. The daily average is the simple mean of the hourly day-ahead prices (24 hours).
- Real-time peaks use the 96 fifteen-minute settlement intervals of complete operating days only. Times are Central (interval ending).
Limitations
- Wholesale prices are not retail rates and do not translate directly into bills.
- Short window; ERCOT's daily pages roll off, so the retained copies are the record. Nov 1 (daylight-saving change) and partial days are excluded.
Data dictionary
| Field | Description |
|---|---|
oper_day | Operating day (YYYY-MM-DD) |
settlement_point | ERCOT hub (HB_) or load zone (LZ_) |
dam_average_usd_per_mwh | Mean of hourly day-ahead prices, $/MWh |
dam_min_usd_per_mwh | Lowest hourly day-ahead price, $/MWh |
dam_max_usd_per_mwh | Highest hourly day-ahead price, $/MWh |
hours | Hours in the day |
source_url | ERCOT page |
source_file_sha256 | SHA-256 of the retained page |
Real time daily peaks file
| Field | Description |
|---|---|
oper_day | Operating day |
settlement_point | ERCOT hub or load zone |
rt_max_usd_per_mwh | Highest 15-minute real-time price, $/MWh |
rt_max_interval_ending | Interval ending time of the peak (Central, HHMM) |
intervals_above_100_usd | 15-minute intervals above $100/MWh |
intervals | Intervals in the day |
rt_average_usd_per_mwh | Simple mean of the 96 intervals, $/MWh |
source_url | ERCOT page |
source_file_sha256 | SHA-256 of the retained page |